GTO+ Review: A Fast GTO Solver With Compact Files and Built-In Analysis
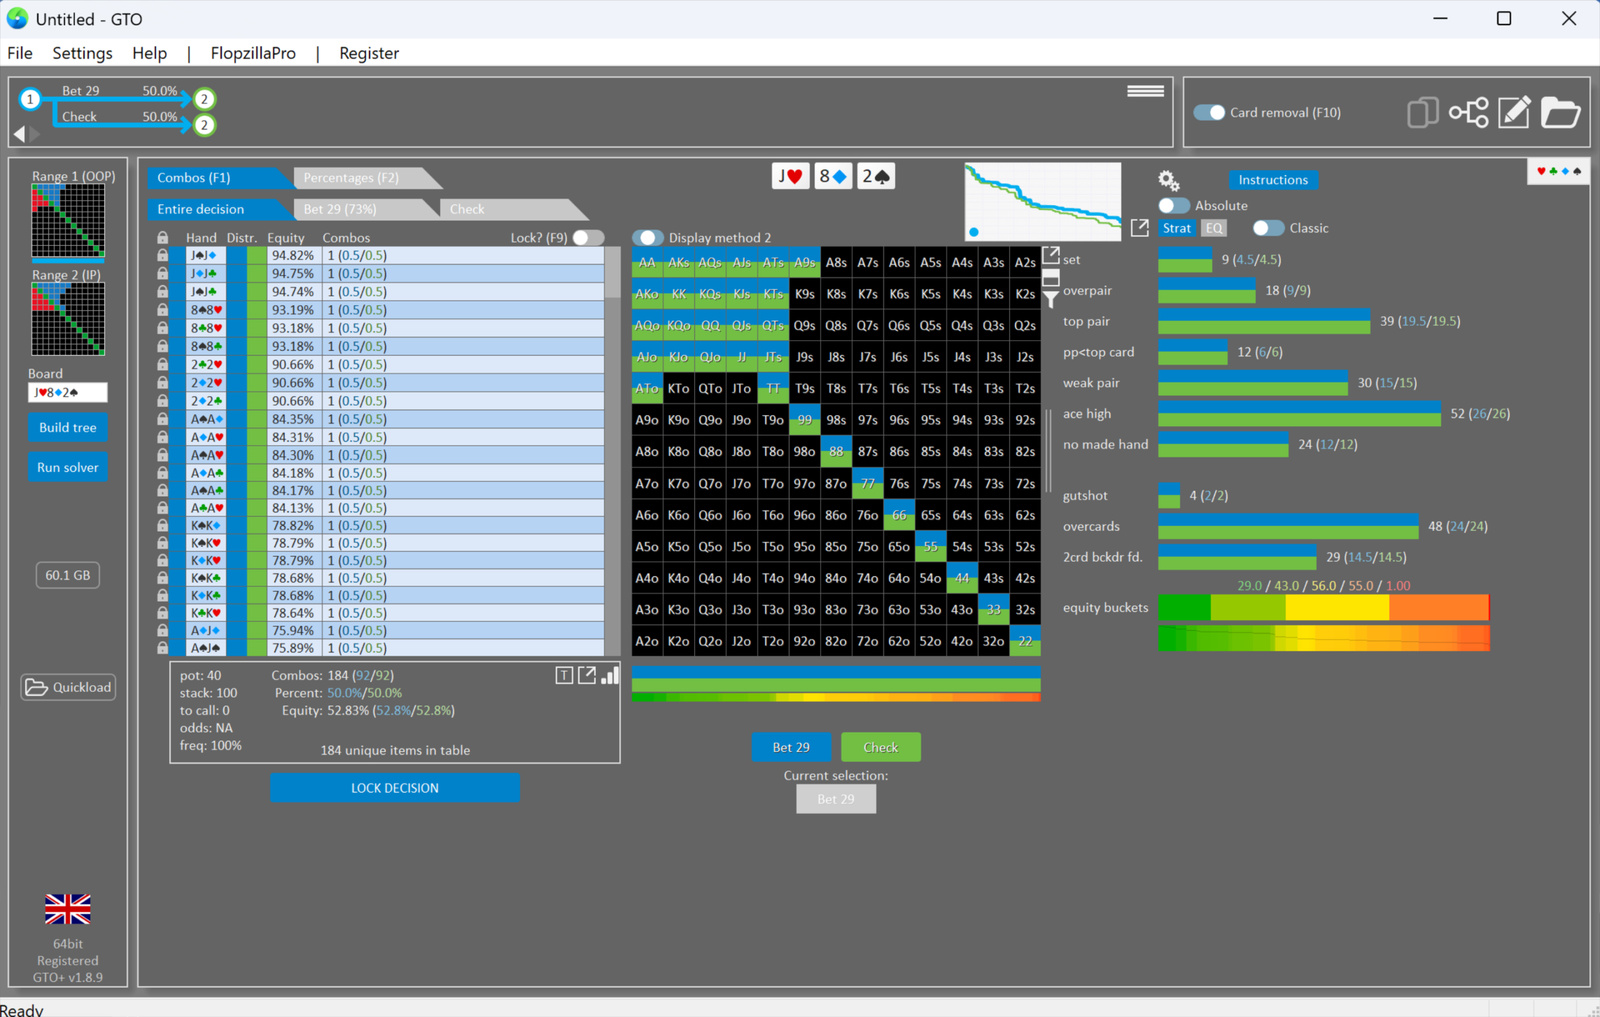
GTO+ is software for calculating the optimal strategy in no-limit hold’em. Tools like this are called solvers: they don’t suggest moves in real time and don’t connect to poker rooms — they’re for reviewing hands you’ve already played or hypothetical ones.
The problem GTO+ solves is easy to state. You describe a situation: which hands you and your opponent could have, which cards are on the board, how much money is in the pot and in the stacks, and which bet sizes are allowed. The software works through the options and finds the equilibrium strategy — the pair of approaches where neither player can increase their winnings by changing their play unilaterally. That strategy is what’s known as GTO (game theory optimal).
For a beginner, a solver gives you something no textbook can: a specific answer to a specific question. Not “on a dry board you usually bet often,” but “in this exact spot a third-pot c-bet goes in 71% of the time, and with this particular hand almost never.”
GTO+ Solutions for Players
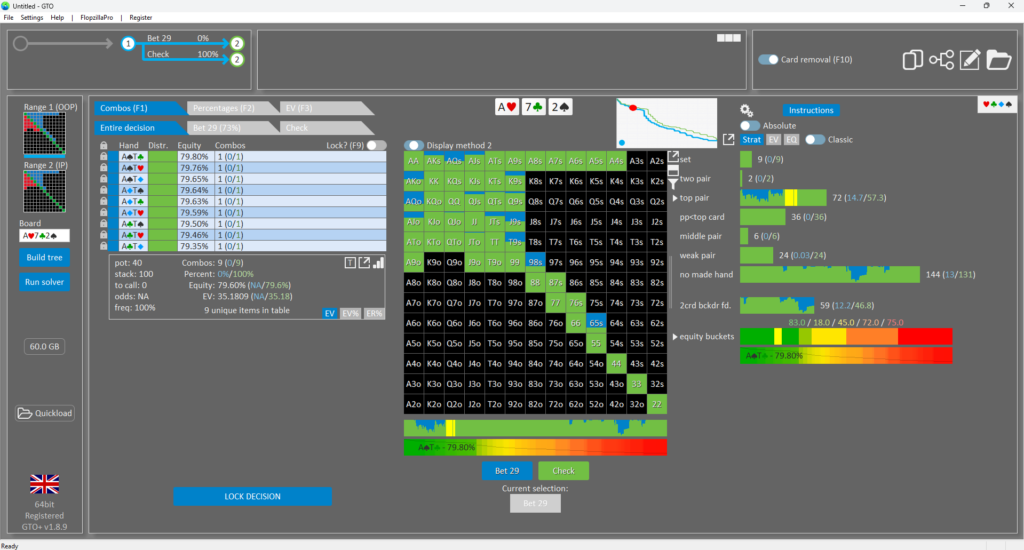
Working with the software always goes in the same loop: build the tree, run the calculation, study the result.
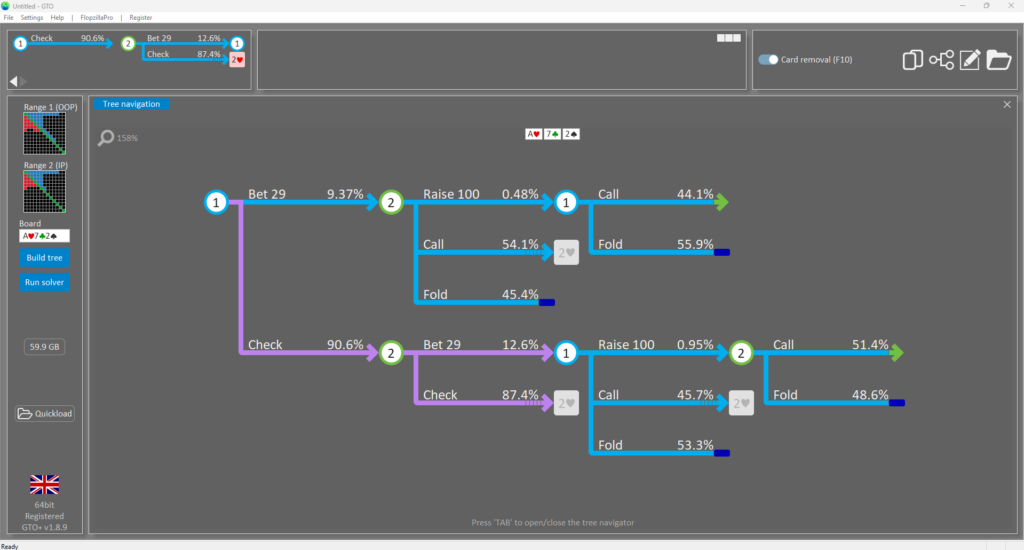
The decision tree is a map of every way the hand can play out. At the root of the tree is the starting situation on the flop, and from there the branches spread out: check, half-pot bet, pot-sized bet, raise, fold. Each branch leads to a new node where the action passes to the other player. The tree isn’t built branch by branch by hand but according to rules you set: “on the flop, bets of 33% and 75% pot are allowed, only one raise, add an overbet on the turn.”
A range is the set of hands a player could have arrived in this spot with. A solver doesn’t calculate one hand against one hand but an entire set against an entire set. That’s why the first and most important step is setting both players’ ranges correctly — a BTN open against a BB defense, for instance.
The solver is the computational engine that runs through the tree thousands of times, gradually refining the action frequencies until the strategy stops improving. The measure of how close a calculation is to the ideal is called the distance from Nash equilibrium: the closer to zero, the more accurate the result.
The solution is the end product. It isn’t a single number but an enormous table: for each of the 1,326 possible starting hand combinations, it shows how often that hand bets, checks, calls, or folds, and how much each of those actions brings in on average.
The Tree Builder: Where Every Calculation Starts
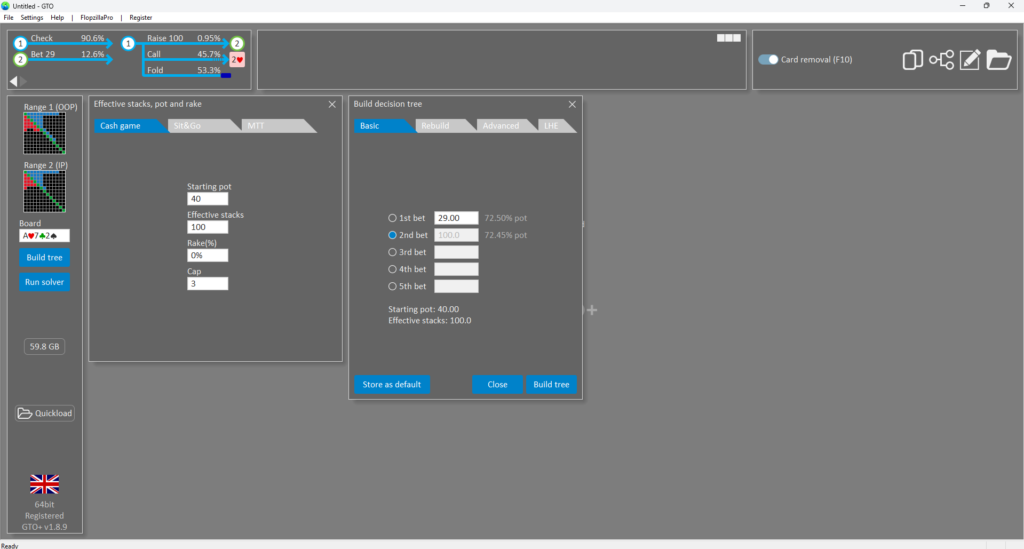
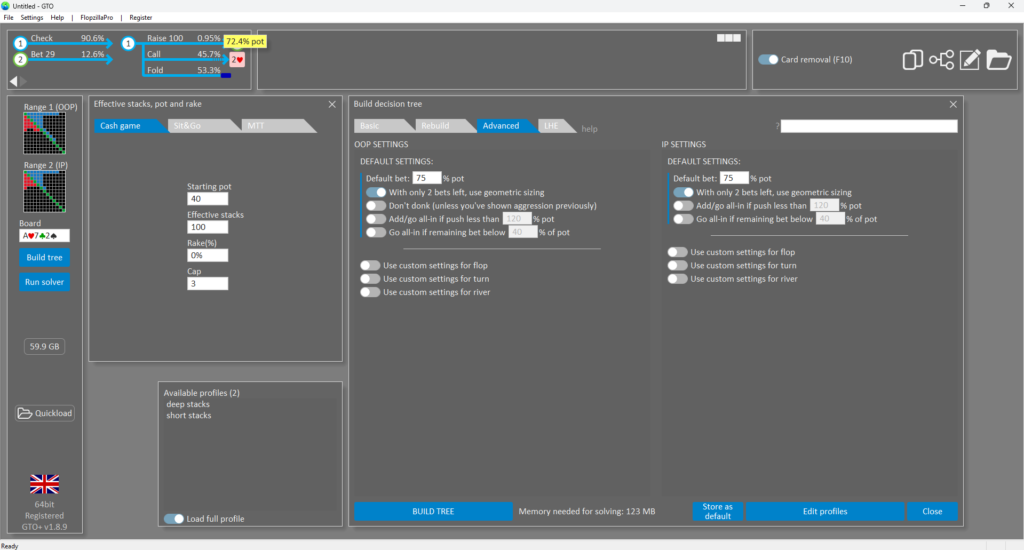
The tree builder is the window where all the starting conditions of a hand are set: the size of the pot on the flop, the effective stack, the board cards, both players’ ranges, and the betting rules.
There are two versions of the builder. The basic one has a minimum of fields and suits a first look: enter a stack, a pot, a board, and one or two bet sizes and you’re done. The advanced one opens up fine-tuning: separate sizes for flop, turn, and river, separate sizes for the in-position and out-of-position player, and multiple allowed bets on a single street.
A few settings are worth going through separately, because these are the ones that save calculation time.
Bet sizes in different formats. A size can be given as a percentage of the pot, as an absolute amount, or as a multiple of the previous bet — an entry of 3x means a raise to three times the opponent’s bet. Geometric sizing is also supported, where the software picks sizes that get the stacks in exactly over the remaining streets.
Smooth stack-off. If there’s little money left in the stacks relative to the pot, you can enable an option that gets the remainder in with two bets of equal geometric step. This avoids awkward situations where you’re left with a 15%-pot bet on the river.
Separate donk bets, probe bets, and c-bets. For the out-of-position player’s first bet on the turn and river, the software lets you set different sizes depending on what happened on the previous street: a donk bet (betting out of position into the previous street’s aggressor), a probe bet (betting after the opponent checks), and a c-bet. This matters in practice, because the optimal sizes for these three situations differ noticeably.
Setting profiles. Frequently used parameter sets are saved under a name and loaded with one click. For regularly reviewing the same kinds of spots — all CO vs. BB single-raised pots, for example — this saves minutes on every calculation.
Tree editor. Once built, a tree isn’t frozen: an individual branch can be deleted, a new action added, or a bet size changed while everything built further down that branch is preserved. There’s no need to rebuild the tree from scratch over one typo.
There are also separate modes for different formats: cash games, sit-and-gos, and MTTs with tournament structure accounted for, plus a dedicated builder for limit hold’em, where bet sizes are fixed by the rules of the game.
Ranges and the Preflop Menu
Ranges are set in the starting hand matrix — the familiar 13×13 grid with pairs down the diagonal, suited combinations above it, and offsuit ones below.
The matrix accepts text input in standard notation: 88+, AJo+, A8s+. Fractional weights work too: AA-77:0.8 means those pairs are in the range with a weight of 80%, meaning the player shows up here with them four times out of five. Fractional weights aren’t a technical nicety but a way to reflect reality: sometimes a player opens a given hand and sometimes they fold it.
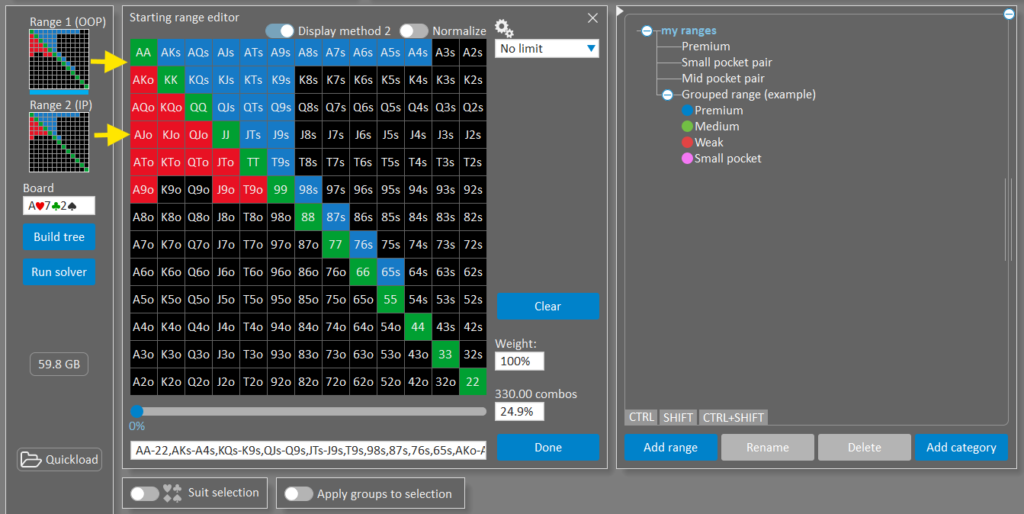
The preset range menu lets you build your own library: save ranges under names, sort them into categories, assign colors, and combine or subtract sets of hands from one another. Ready-made ranges can be imported. For a beginner this is a way to get your opening and defending charts in order once and then stop typing them in before every calculation.
You can also select specific suits: if you want to see how a pair of diamonds specifically plays rather than the pair in general, a hand can be restricted to the suits you need.
Running a Calculation and What Convergence Means
Once the tree is built, the calculation starts. The software runs through all the branches repeatedly, refining the frequencies as it closes in on equilibrium.
The key metric is the distance from Nash equilibrium, expressed as a percentage. It shows how badly an opponent could punish the current strategy if they played against it perfectly. GTO+ runs the calculation down to zero — to full convergence, not to an approximate result.
Why this matters to a beginner: an under-solved solution looks exactly like a fully solved one — same tables, same numbers. The difference shows up in rare and close situations, such as picking bluff combinations on the river, where the error in an approximate calculation can flip a conclusion to the opposite one. The rule is simple: stop the calculation when the number reaches zero, not when it “looks close enough.”
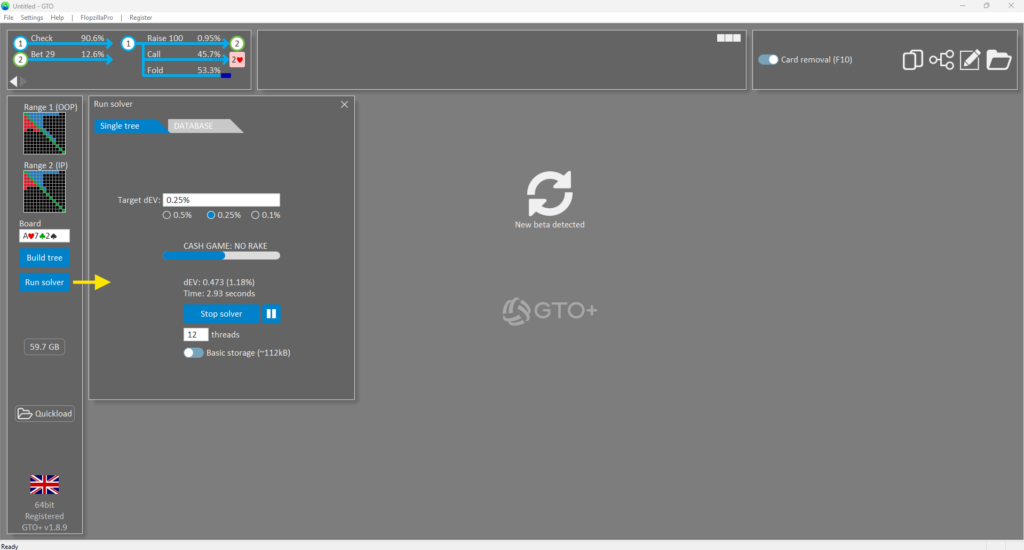
Calculation speed depends almost entirely on the processor: it’s proportional to clock speed multiplied by the number of physical cores. RAM doesn’t affect speed — it caps the maximum size of tree that will fit in a calculation. Thanks to on-the-fly compression, the software gets by with a relatively modest amount of memory, and saved files come out compact because some of the data is recalculated on opening rather than stored on disk.
The Tree Navigator and Reading a Solution
A finished solution is examined through the navigator, a panel that lets you walk through the hand step by step: flop, bet, call, a specific turn card, check, and so on to the river.
There are two data storage modes. The basic one keeps the solution viewable up to the turn, the extended one all the way through the river. Extended is more convenient, but the files come out larger and the calculation takes longer, so the choice depends on the task.
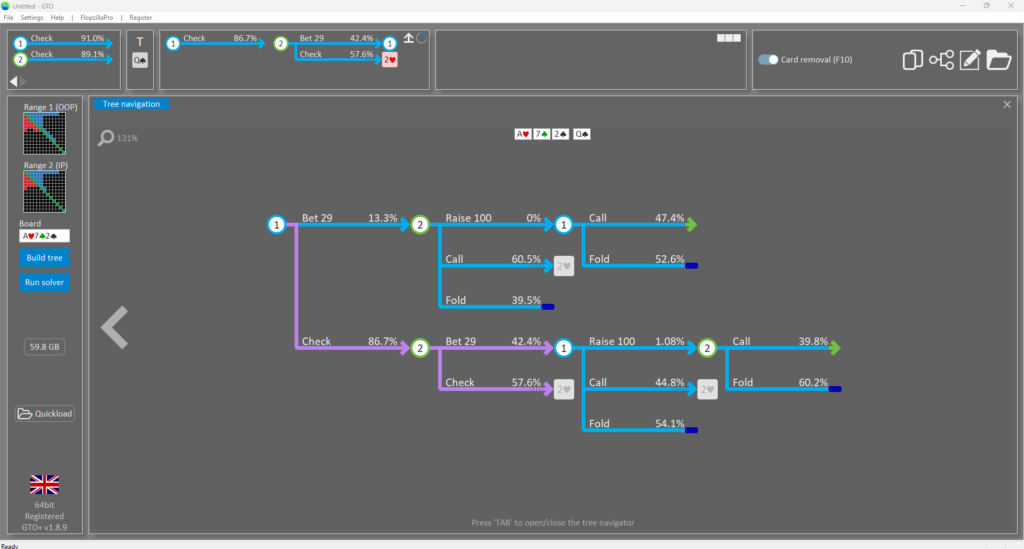
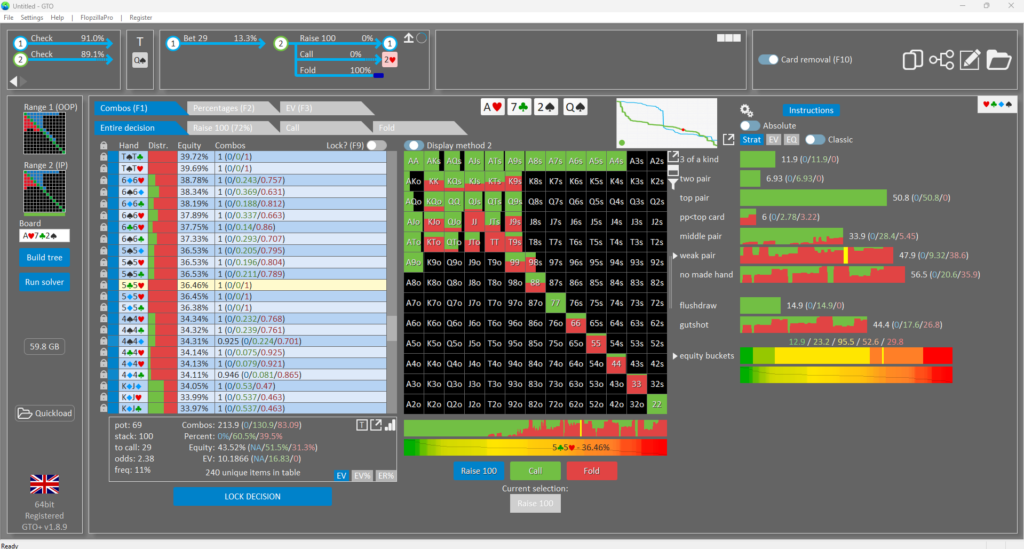
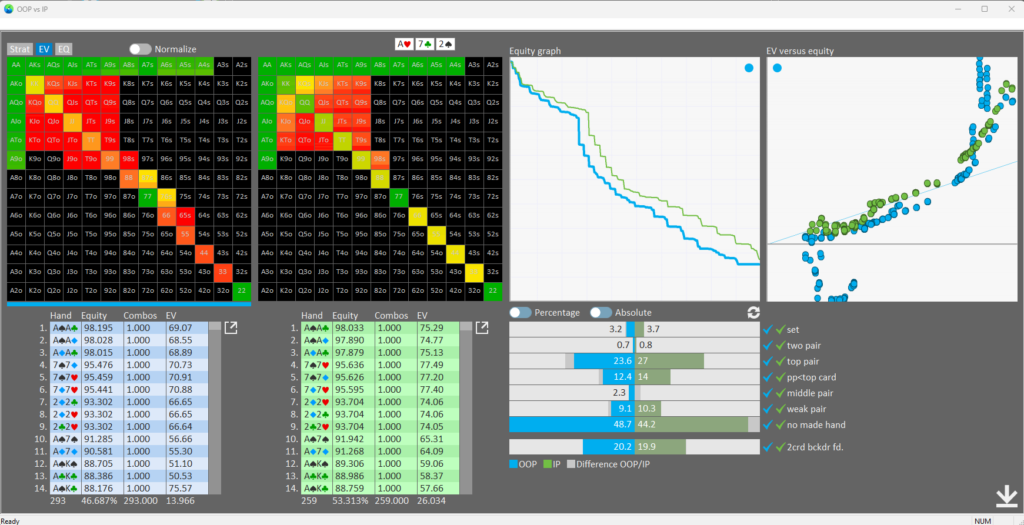
The main working area is the hand matrix, color-coded by action. Each cell shows what that hand does and in what proportion: one share of the cell in one color for betting, another in a different color for checking. Below the matrix are tables showing action frequencies, range equity, and the expected value of each decision.
A separate tool compares range against range: it shows whose set of hands is stronger on the given board and how strong and weak hands are distributed on both sides. This is the fastest way to understand why on one board betting almost always is optimal while on another it’s almost never right.
Card blocking toggle. One button turns on and off the accounting for how the cards in your hand remove combinations from your opponent’s range. Being able to compare the two states makes it vividly clear why two hands of equal strength play differently: holding an ace, for instance, reduces the number of possible aces your opponent can have, which makes it a better bluffing candidate.
Hand class filters. Instead of reading all 169 cells in the matrix, you can pull out just the group you want: top pairs, flush draws, complete air. For a review this is essential: a conclusion like “top pair with a weak kicker checks here” sticks in your memory, while a table of 169 numbers doesn’t.
Statistics. Below the tables are summary figures for the whole range: how often it bets, what share of it is strong hands, how many bluffs there are per bet. Values are shown either as raw combo counts or as percentages.
Editing and Locking a Solution
The most valuable feature in practical terms is the ability to depart from the ideal. Real opponents don’t play equilibrium, and analyzing their mistakes makes more money than memorizing the optimal strategy.
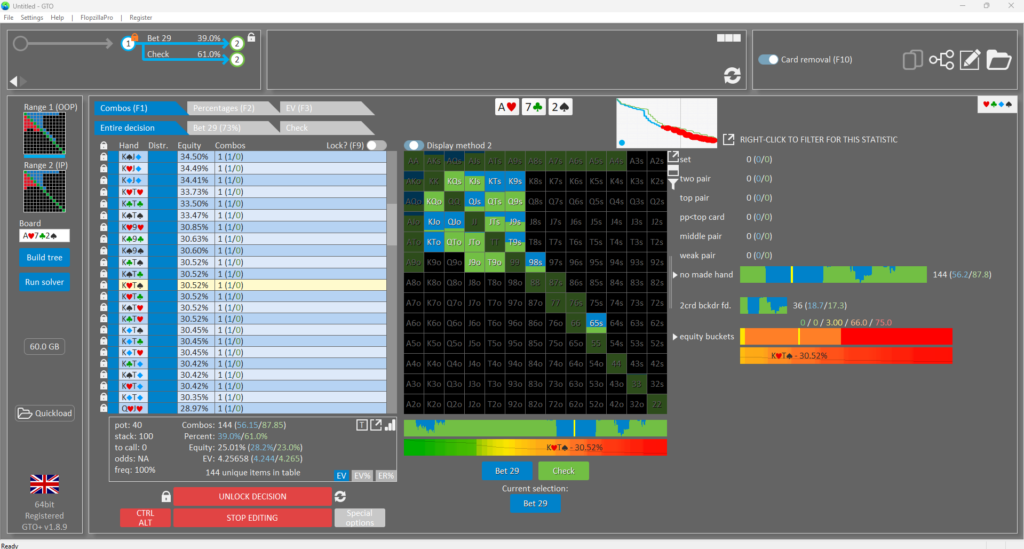
The mechanics: at any node in the tree, the solution can be locked and then edited by hand. You might set the opponent’s strategy to “calls a c-bet with every pair,” a typical low-stakes mistake. The software then recalculates the rest of the tree and shows how to play optimally against that behavior. As a rule, the answer turns out to be noticeably more aggressive — or, conversely, more passive — than the equilibrium one.
Locking and editing are split into two separate actions: first the node is fixed in place, then changes are made inside it. The software marks trees that contain locked nodes and shows a list of them when you hover over the icon, so a month later you won’t confuse an edited solution with the original.
Every change made after a calculation goes into a shared undo history: any edit can be rolled back individually without recalculating the tree.
Recalculating a Single Branch
A common situation during a review: the solution is ready, but a question comes up — what would happen if an overbet were allowed on the turn?
In most solvers, answering that means a complete recalculation from scratch. Here it’s enough to recalculate the line you need: bet sizes in a specific turn and river run are changed, and only the affected part of the tree is recalculated. Testing a hypothesis takes seconds instead of minutes, and that changes the character of the work — testing an idea stops feeling like time you can’t spare.
Individual turn and river branches can also be broken out into their own window and worked with as an independent solution, or exported externally.
Turn and River Reports
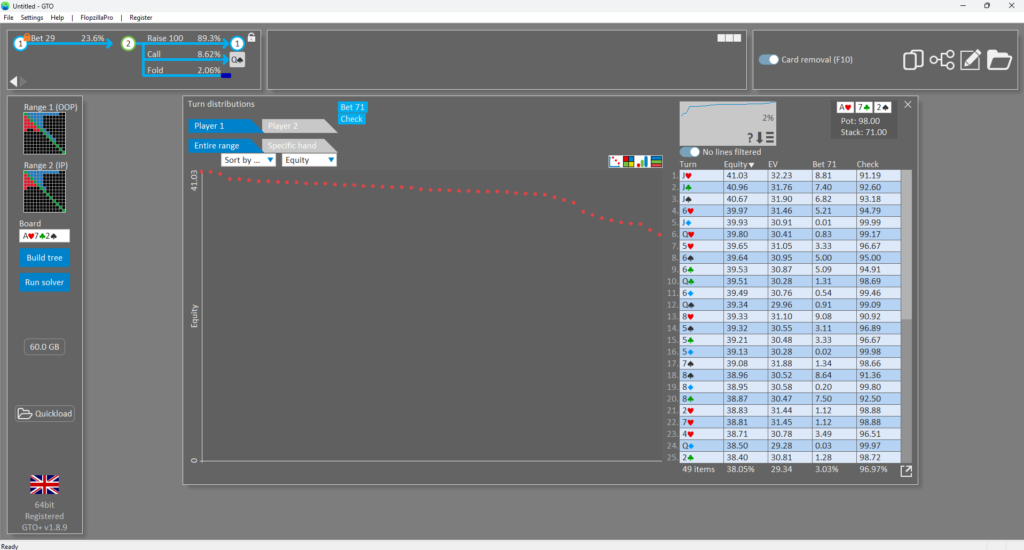
A single hand rarely reveals a pattern. Street reports show the solution for every possible turn or river card at once, in table form: for each card you get equity, expected value, and betting frequencies.
The table sorts by any column — by betting frequency, by equity, or by the card itself. That way you can see at a glance which turn cards sharply strengthen a range and which ones make it give up. Double-clicking a row opens the corresponding tree in full.
One important caveat: the numbers in the table correspond to the moment the calculation finished, and when a specific line is opened the software performs a refining recalculation. For rarely reached lines the values may differ slightly — that’s normal behavior, not a bug.
Tree Databases and Aggregate Reports
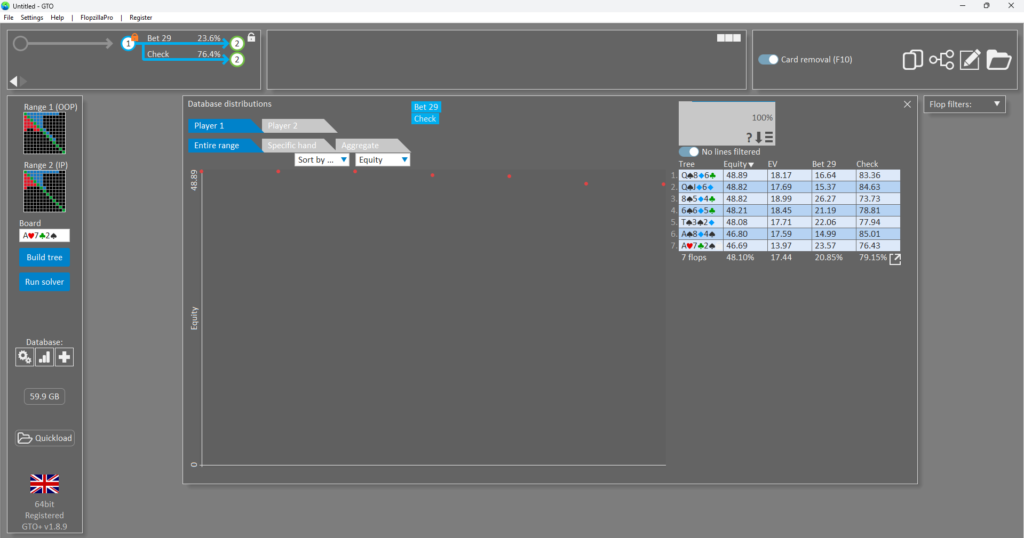
The next level of generalization is calculating not one board but a whole set of them and pulling the results into a single table.
A database is a collection of solved trees with identical conditions and different flops, saved in one file. The software can select flops by their characteristics: monotone, rainbow, paired, ace-high. There are ready-made reduced sets, suit standardization, and the option to load your own list of boards.
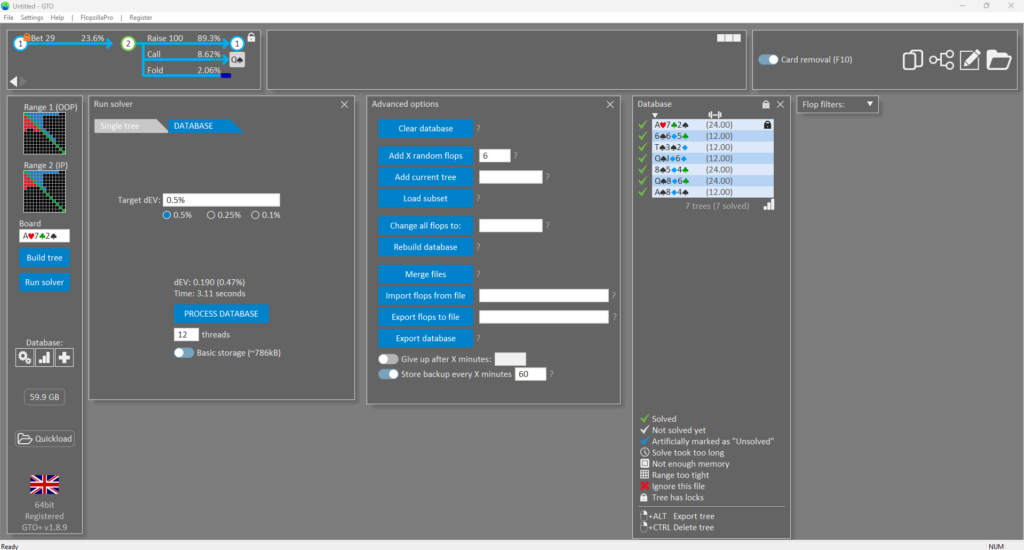
An aggregate report on a database like that shows how a strategy behaves across the entire set of boards: where a c-bet goes in almost always, where almost never, and how bet sizing depends on flop texture. The table sorts by metric value, by flop properties, or in the original order. Individual trees in the database can be disabled or deleted if they turn out to be unnecessary.
For a beginner, aggregate reports are more useful than analyzing individual hands: they’re where the rules that actually apply at the table come from. For example: “on ace-high boards the aggressor bets small almost always; on connected middling boards, noticeably less often.”
If there isn’t enough RAM for a large database, there’s a workaround: the set is calculated in parts and then merged into one file.
Graphs
The graphing system plots any metric against any other at any point in a solution. Typical examples: how betting frequency changes with hand strength, how expected value is distributed within a range, and how much stronger one range is than another across different segments.
A graph often explains what gets lost in a table. Overlaying the strength curves of two ranges, for instance, shows immediately which one has more very strong hands and which has more medium ones.
Scripts and Batch Processing
For repetitive work there’s a scripting mode: a sequence of actions is described once and then executed automatically across a set of files. The software can process every file in a specified folder in turn.
The practical point: prepare a set of spots in the evening, start the calculation overnight, and have finished solutions in the morning. A beginner won’t need this right away, but as a library of analyzed spots grows, this mode saves hours.
Solution results can be exported as text for further processing, and the lines you play can be exported in hand history format.
Playing Against the Solution
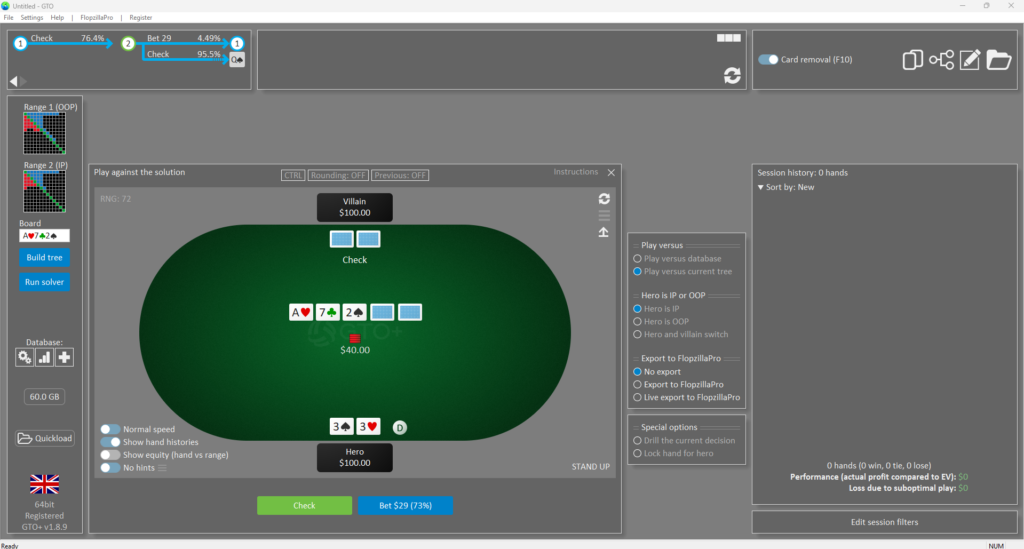
A separate mode turns the solver into a trainer. It seats you at a virtual table and deals hands from a calculated tree, or from an entire database of trees, playing your opponent according to the optimal strategy it found.
How it works in practice:
- Actions are chosen with buttons, just like at a normal table. A hint showing the correct frequencies can be called up at any moment, or you can play blind and look at the results later.
- Correct actions are highlighted in green, incorrect ones in red. Next to each action is its share in the optimal strategy, with the most frequent one marked out.
- A play-quality score is kept: the software shows how much you earned compared to what error-free play would have brought in, and graphs that difference over the course of a session.
- You can leave the table at any point, look at the solution in the navigator, and return to the same hand.
- There’s an autoplay mode where the solver plays against itself — useful for simply watching typical lines unfold.
- Learning aids are built in: peek at the opponent’s hand, look at the upcoming turn and river cards, or deal the opponent a different hand from their range. That last one is a handy way to see a range as a whole: cycling through the hands one by one makes it easier to understand what an opponent actually shows up with in this line.
One detail matters for reading the results correctly: when choosing an action, go by the frequencies, not by the expected value of the individual options. If the solution calls for calling 96% of the time and raising 4%, a slightly higher EV for the raise doesn’t make it the right choice — the whole point of a mixed strategy is the proportion.
Integration With Flopzilla Pro
While you’re playing against a solution, ranges can be exported to Flopzilla Pro, a tool for analyzing range structure. There, a set of hands is broken down by category: how many made hands are in it, how many draws, how much pure air.
This is a useful complement to the solver: GTO+ answers “how to play,” while a range structure breakdown answers “why that way.” The feature requires the separate software, and in its trial mode it doesn’t work on all boards.
Compatibility: Formats and Sites
Games. No-limit hold’em is the main area of work. The tree builder also supports limit hold’em. For short deck (6+ hold’em) there’s a separate program with modified rules: deuces through fives are removed from the deck, a flush beats a full house, A6789 counts as a straight, and the ranking of a set versus a straight is switched with a setting.
Formats. Cash games, sit-and-gos, and MTTs — the structure is chosen when the tree is built, so the calculation accounts for the specifics of tournament prize distribution.
Number of players. The main use case is heads-up play after the flop. Multiway pots take substantially longer to solve and require noticeably more memory, so it makes sense to limit the number of bet sizes for them.
Poker rooms. The software doesn’t connect to rooms and doesn’t run during play: it’s a tool for reviewing between sessions. Using solvers at the table in real time is prohibited by the rules of every major site.
Operating system. Windows 7 and up, with the 64-bit version strongly recommended. There’s no macOS build; on Apple computers the software is run through a virtual machine or Boot Camp, with some loss of performance.
Hardware requirements. Minimum: a quad-core 2 GHz processor, 8 GB of free RAM, and 10 GB of disk space. The graphics card is irrelevant. Calculation speed grows almost linearly with the number of physical cores, so the processor is the one component not to skimp on.
Known limitations. Calculations start from the flop: the software doesn’t build a full preflop tree but takes ranges as input, so opening and defending charts have to come from somewhere else. The interface is dense and utilitarian, with no gentle onboarding for beginners.
Getting Started
Getting going comes down to a few steps.
- Download the software from the official site and install it. The 64-bit build is recommended.
- Launch it without paying and look around. The free mode has no time limit, though some features aren’t available in it — enough to figure out whether the software suits you.
- Build your first tree in the basic builder. A sensible first calculation: a BTN vs. BB single-raised pot, 100 big blind stacks, one c-bet size, one raise size. A tree like that solves quickly and doesn’t overwhelm you.
- Wait until the distance from equilibrium reaches zero, and only then look at the result.
- Study the solution through the matrix and the hand class filters. One review, one conclusion, written down in plain language.
- Play the same spot in the play-against-the-solution mode so the conclusion sticks in practice.
Buying a license requires a hardware ID, which is found in the registration menu inside the software. The key arrives by email and is entered in the same place. Changing computers or reinstalling the operating system changes the ID, and the key is reissued.
A sensible learning pace is one spot per session. Twenty trees in a row will give you nothing but fatigue: the point of a review isn’t the number of calculations but the rules you draw out of them.
Pricing
Payment is one-time; there’s no subscription. The free mode is available with no time limit but with a reduced feature set. The main license is registered to one computer and includes all future updates; a reduced price is available for a second computer belonging to the same owner. The short deck program is purchased separately.
A detailed breakdown of plans and prices is on the product description page.
The Bottom Line
GTO+ is one of the most accessible ways to start working with a solver seriously. A one-time payment instead of a subscription, calculations run to full convergence, compact files, and built-in analysis tools cover the whole cycle: build the spot, solve it, understand it, drill it.
The weak points are just as clear: Windows only, a utilitarian interface, and a noticeable learning curve. The first few hours go into learning the software rather than learning poker.
It’s best picked up gradually. Start with the basic builder and reading the matrix, then move to filters and range comparison, then flop databases and aggregate reports, and only after that to editing solutions and scripting. The value of a solver isn’t measured by the number of trees you’ve solved but by the number of rules you’ve managed to carry from them to the tab

Featured software

Latest posts
-
 Poker Academy Review: Ranges, Solver, and Trainer in One Browser Window Oct 11, 2026
 -
 SmartHand Review: Opponent Stats Before the First Hand Oct 10, 2026
 -
 888Caption Review: A Tool for Fast-Paced Multi-Tabling Oct 9, 2026
 -
 Preflop ICM Solving in GTO Wizard: ICM-Aware Preflop Solutions in Seconds Oct 8, 2026
 -
 Octopi Poker Review: Tournament GTO With Pro Hand Reviews Oct 7, 2026
All the poker software you need, gathered in one place. Exclusive discounts, bonuses, latest news and updates.
Join now