SharkScope Review: Tournament Results Database and Opponent Statistics
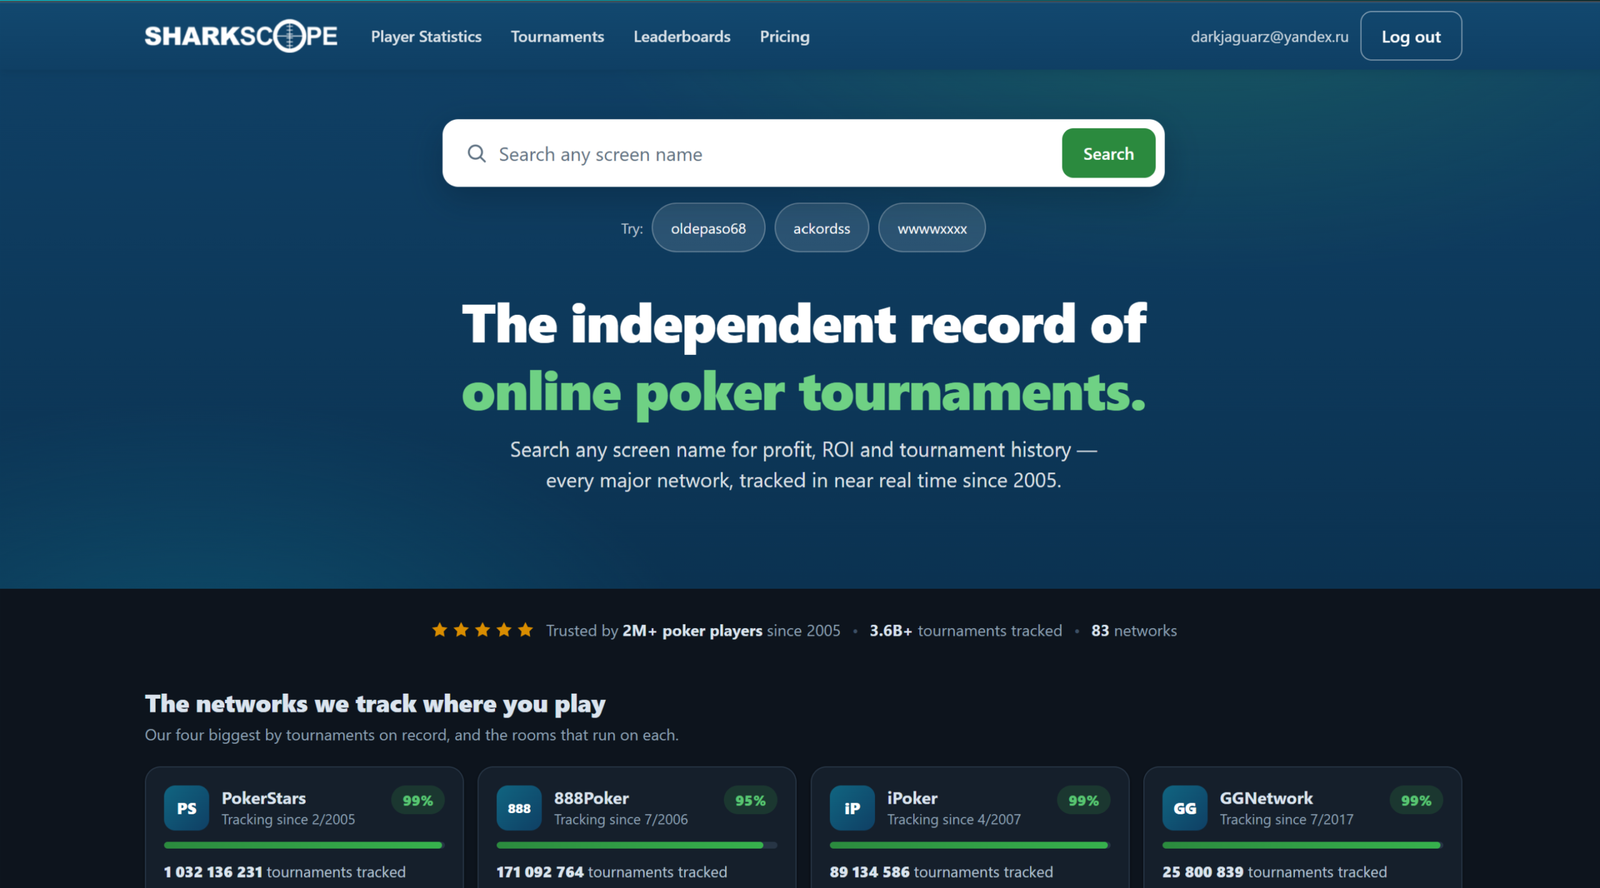
SharkScope is a service that collects online tournament and sit-and-go results from numerous poker networks and stores them in a single database. Search for any screen name, and it will show how many tournaments the player has played, their profit, ROI, in-the-money percentage, and average buy-in. For beginners, it is the first tool that turns an unfamiliar name at the table into a clear player profile: a high-volume regular, a casual recreational player, or someone playing their first-ever tournament.
The service serves two different purposes. The first is research: finding out who is at the table and which tournaments are worth playing. The second is personal tracking: viewing your results over months and years without maintaining spreadsheets manually, as the database records them automatically. A separate desktop application also provides a HUD at the poker tables and tools for analyzing your own hands.
It is important to establish the limitations right away. SharkScope only works with tournament formats—MTTs, sit-and-gos, spins, and other games with buy-ins and prize pools. Cash games are not included in the database at all, and the developers specifically state that they have no plans to add them. For cash tables, you need a tracker that imports hand history files.
Where the Data Comes From and What a Search Means
The service works more simply than it might seem. Poker rooms do not provide SharkScope with any data. Instead, the service independently collects tournament results that are publicly displayed in poker room lobbies after play has ended: who participated, where they finished, and how much they won. These results are stored in the database and linked to each screen name on a particular network. According to the service, its coverage exceeds 99%—most tournaments are recorded within a few minutes of finishing, although delays on some platforms may be as long as two days.
This leads to a key characteristic of the service: it knows the tournament result but does not know what happened in individual hands. SharkScope can see that a player finished fourth out of 180 entrants, but it cannot see which hands they opened from the button or how often they made a continuation bet on the flop. SharkScope statistics therefore answer the question “How successful is this player overall?” rather than “How do they play a particular hand?”
The second basic concept is a search. One search is deducted when you request statistics for a screen name or tournament ID, as well as when a screen name is loaded from a saved table or list of participants. Viewing previously loaded data and your own results does not consume additional searches. The daily search allowance is the main difference between subscription plans: without a subscription, you receive five searches per day, while paid plans offer anywhere from ten to several thousand. The counter resets at midnight Pacific Time.
What the Player Profile Shows
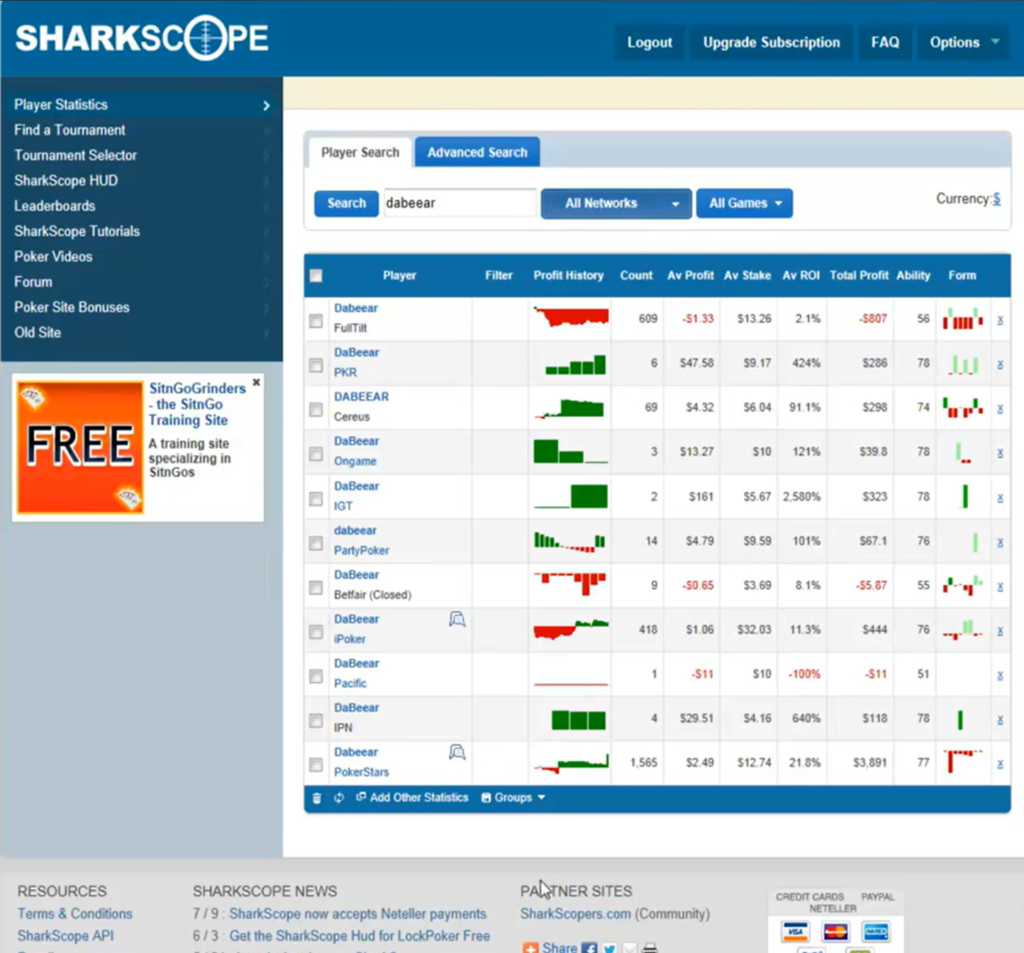
A search returns a detailed profile for the screen name on the selected network. The core set of metrics includes:
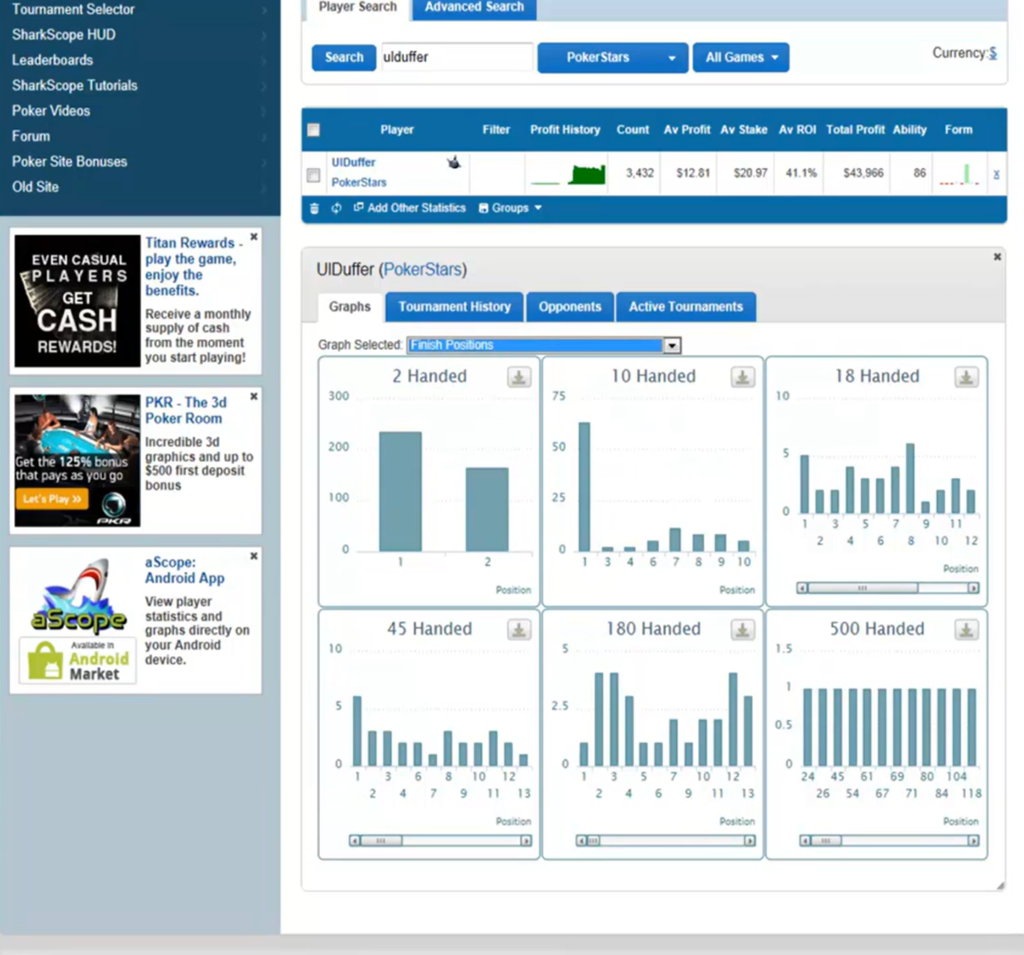
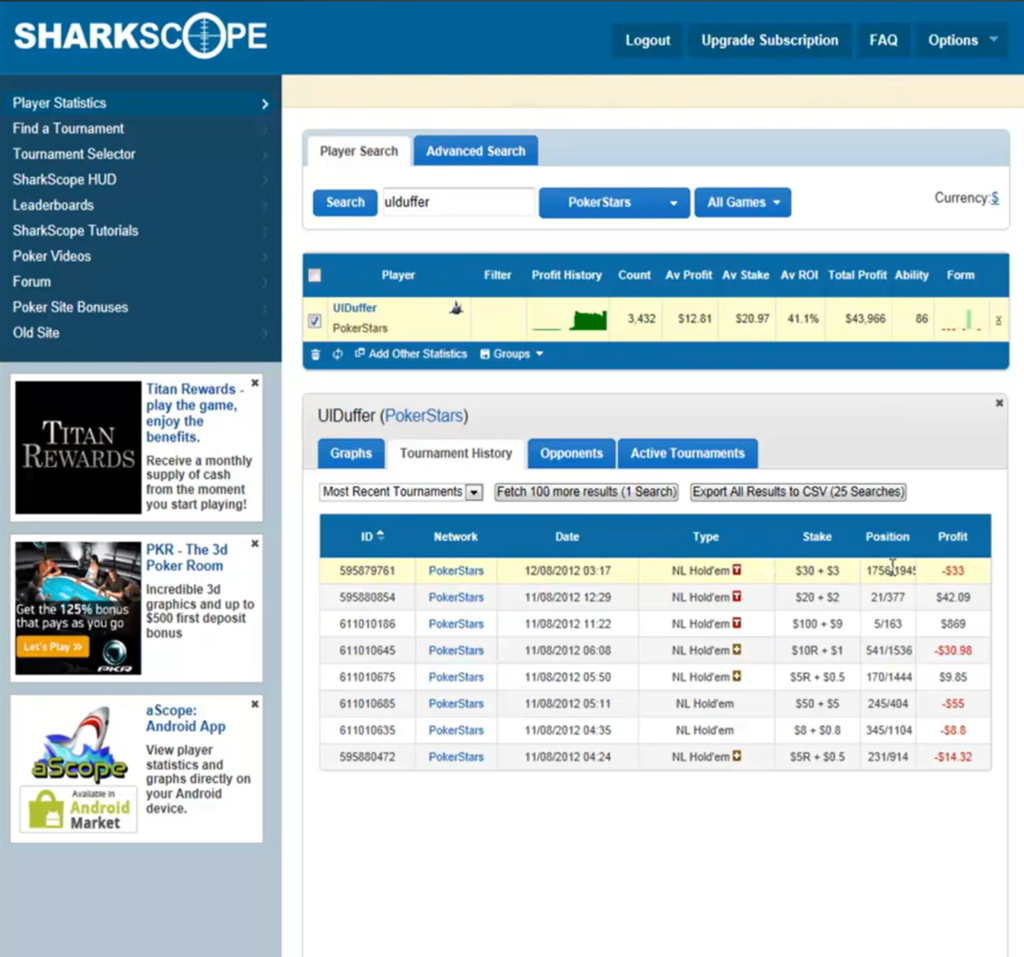
Profit is the player’s total lifetime profit after rake—in other words, their net result after buy-ins and poker room fees have been deducted.
Av. ROI is the average return on money invested. It is calculated as the average result for each tournament: how much the player received relative to the buy-in including rake. A player who loses every tournament has a value of −100%. The advantage of this metric is that it is independent of buy-in level: a 7% ROI in expensive tournaments is an excellent result, while at the micro stakes it is mediocre.
ITM% is the percentage of tournaments in which the player finished in the money.
Count and Av. Stake are the total number of tournaments played and the average buy-in. These two metrics should be considered alongside the others: one hundred tournaments is far too small a sample for drawing conclusions about ROI, while several thousand can already reveal a great deal.
Ability is the service’s proprietary rating on a scale of up to 100. It combines all the other metrics into a single number and allows players competing at different stakes and in different formats to be compared. The logic is that a player who loses slightly in expensive tournaments is probably stronger than someone who wins slightly in the cheapest games, and the rating takes this into account.
Additional information includes streaks—the longest sequences of wins, losses, and cashes—the number of profitable and unprofitable days, the share of turbo tournaments in the player’s volume, and a distribution of finishes by stage, such as the percentage of tournaments in which the player was eliminated in the first third or reached the top 10%. The last breakdown is particularly useful: it shows whether an opponent tends to make risky decisions early or, conversely, plays carefully enough to reach the money.
For quick assessments, the service displays icons next to screen names: a shark means that the player has automatically been classified as strong, while a fish means that they have been classified as weak. By default, approximately 15% of players fall into the top category and the same percentage into the bottom category. Subscribers can change these thresholds or create their own categories.
Filters and In-Depth Breakdowns
All-time statistics are a blunt instrument. A player may have spent three years playing $1 games and only recently moved up to meaningful stakes, in which case their overall ROI says nothing about their current form. Subscribers therefore get access to advanced search filters for date, network, tournament type, structure speed, buy-in, and number of entrants.
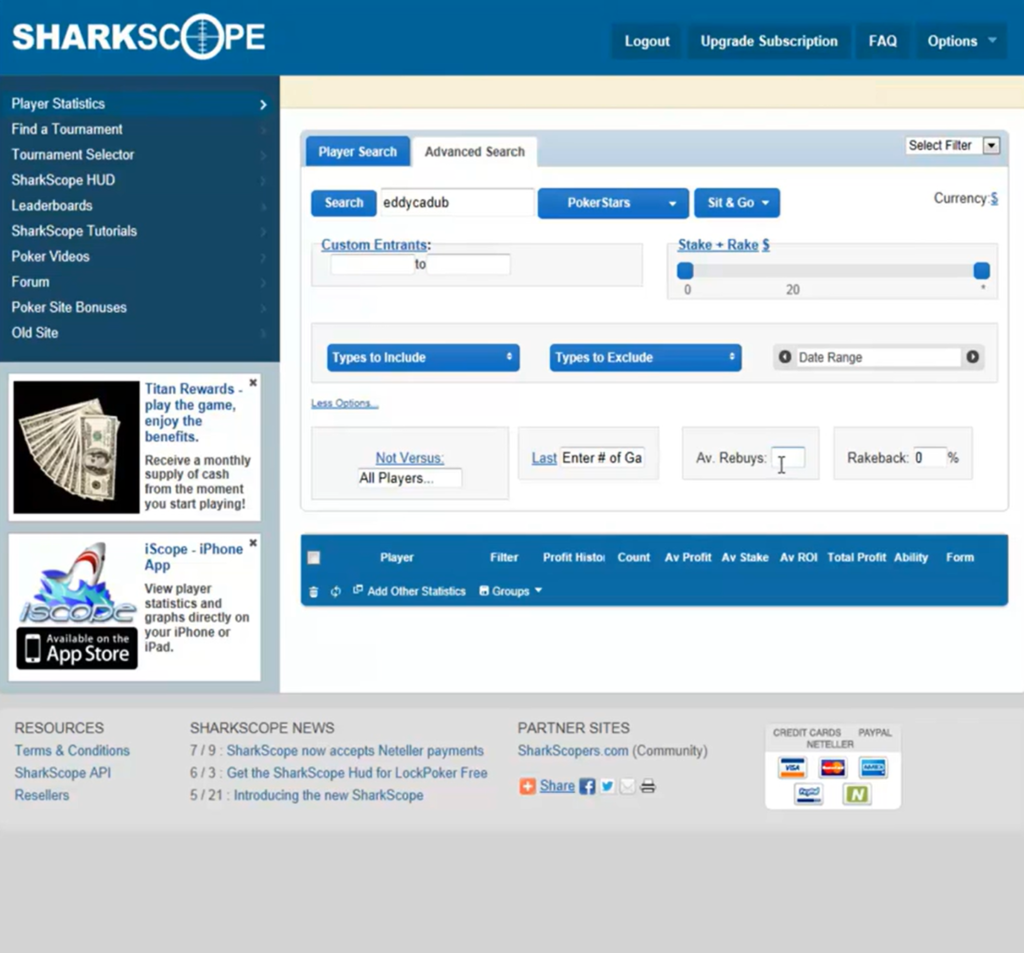
The practical benefit is simple: instead of learning that “this player is profitable overall,” you can find out that “over the past year, this player has had a negative ROI in $20–$50 tournaments with normal structures.” That is actionable information you can use at the table.
The service standardizes structure speeds into the categories Deep, Normal, Turbo, and Hyper because poker rooms use different names for the same structures: one room might call a format “Super Turbo,” while another calls it “Hyper.” This standardization makes it possible to compare players from different networks on the same scale.
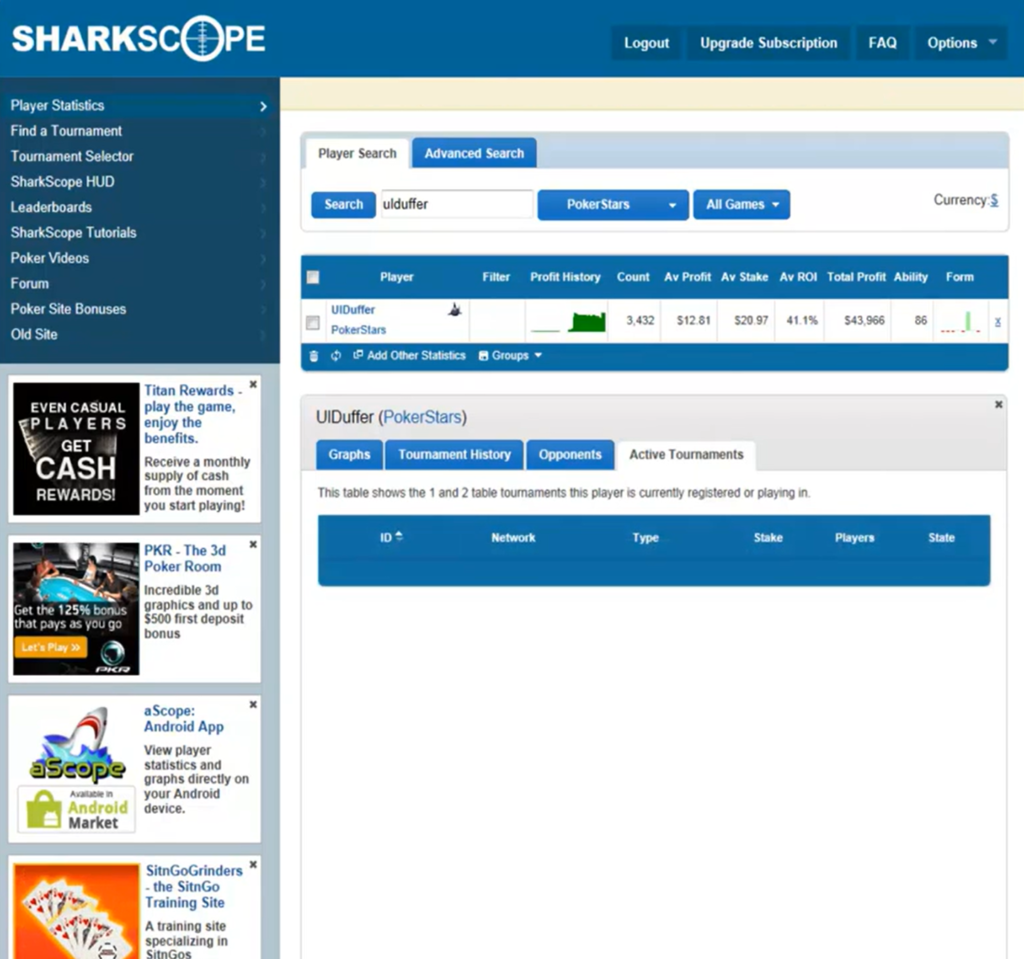
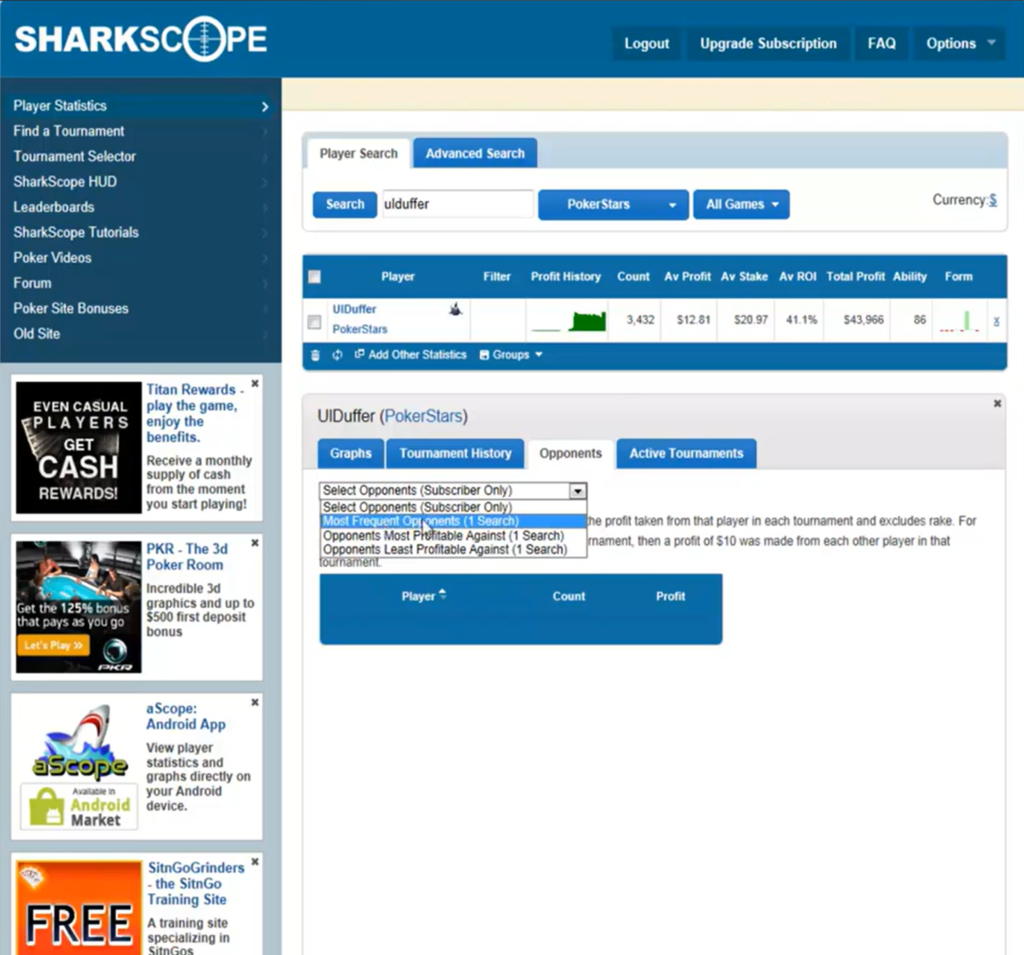
Subscribers also receive breakdowns that are unavailable in the free version: profit by hour and day of the week, results by tournament type, most frequent and most profitable opponents, the number of tables played simultaneously, time spent playing, average tournament duration, and profit concentration. The time-of-play breakdown answers a practical question: at what times do particular tournaments attract weaker fields?
Tournament Selection
Tournament Selector is a separate tool. Rather than evaluating individual players, it assesses the tournaments themselves. The service takes the tournament entrants, excludes anyone with fewer than one hundred recorded results, calculates the average ROI of the remaining players, and presents the rating using icons. Every positive 10 percentage points of average field ROI adds one shark, while every negative 10 percentage points adds one fish.
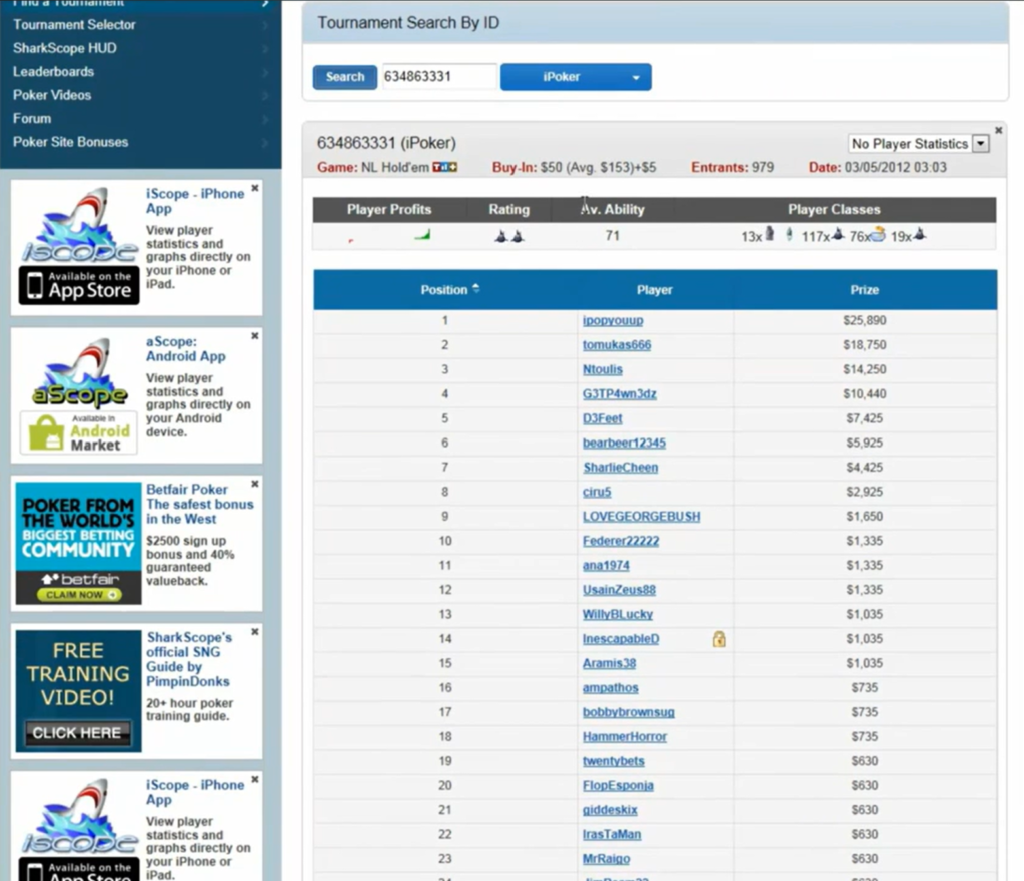
The value for beginners is straightforward: a field in which the average entrant is consistently profitable will cost more in the long run than a tournament with a similar buy-in and weaker competition. Tournament selection is a decision made before the cards are dealt, and it affects your results just as much as your play at the table.
Personal Statistics and Leaderboards
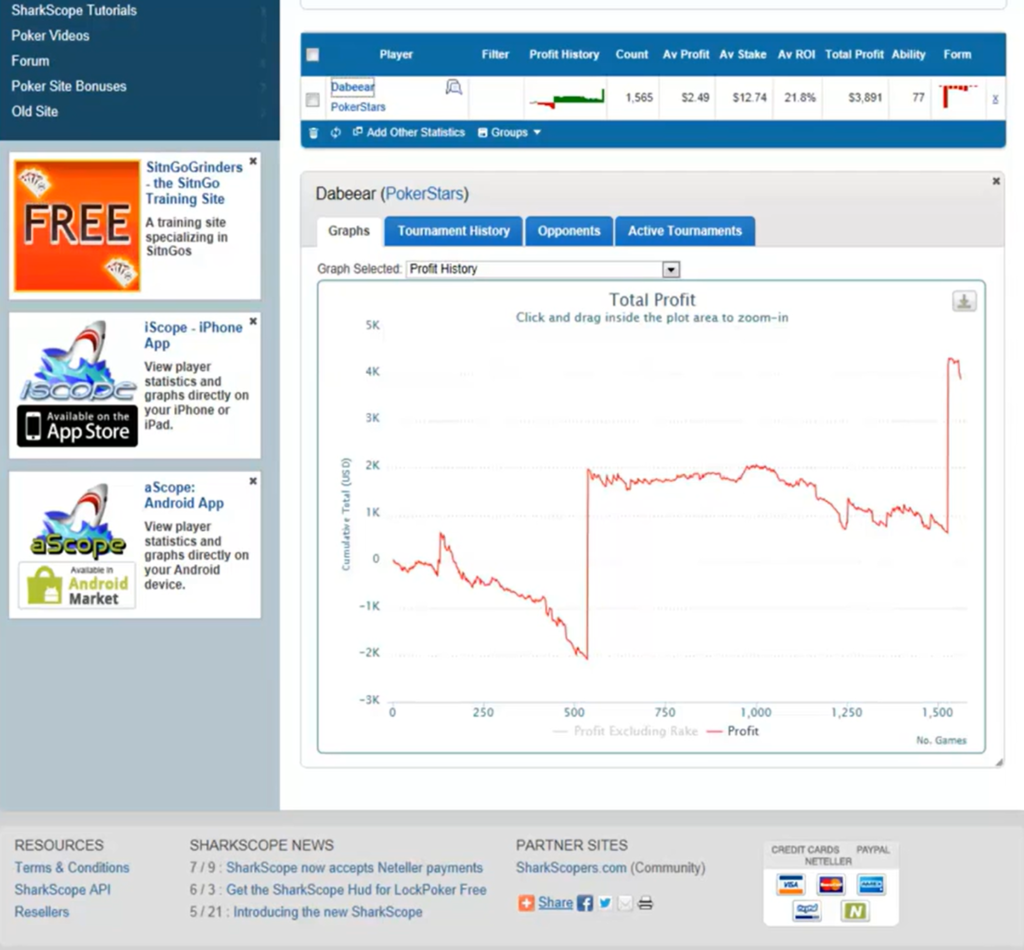
Your results are imported automatically based on your screen name, so there is no need to track them manually. The service creates a cumulative profit graph, shows ROI by format and stake, and calculates streaks as well as winning and losing days. Subscribers can reset their statistics from a selected date if older results no longer reflect their current skill level; in this case, a reset notice remains next to the screen name.
Results from multiple screen names and even multiple networks can be combined into a player group, allowing statistics to be calculated across the entire volume. This is useful for anyone who plays on several platforms.
Leaderboards rank players by profit and ROI within specific buy-in ranges and formats. Inclusion is not automatic: a player must be submitted for consideration, and private accounts are not eligible for the rankings.
It is also worth knowing about the opt-out system. Any player can submit a request to hide their statistics, after which their data becomes unavailable to everyone, including the player themselves. Keep this in mind: some opponents at the table simply will not appear in the database, and an absence of results does not mean that a player is a beginner.
Desktop Software: HUD, Hand Tracking, and Synchronization
SharkScope Desktop is a separate computer application that combines three tools.
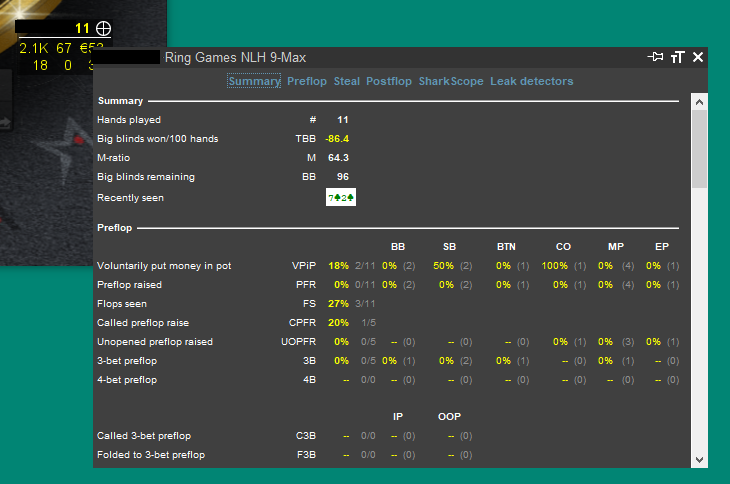
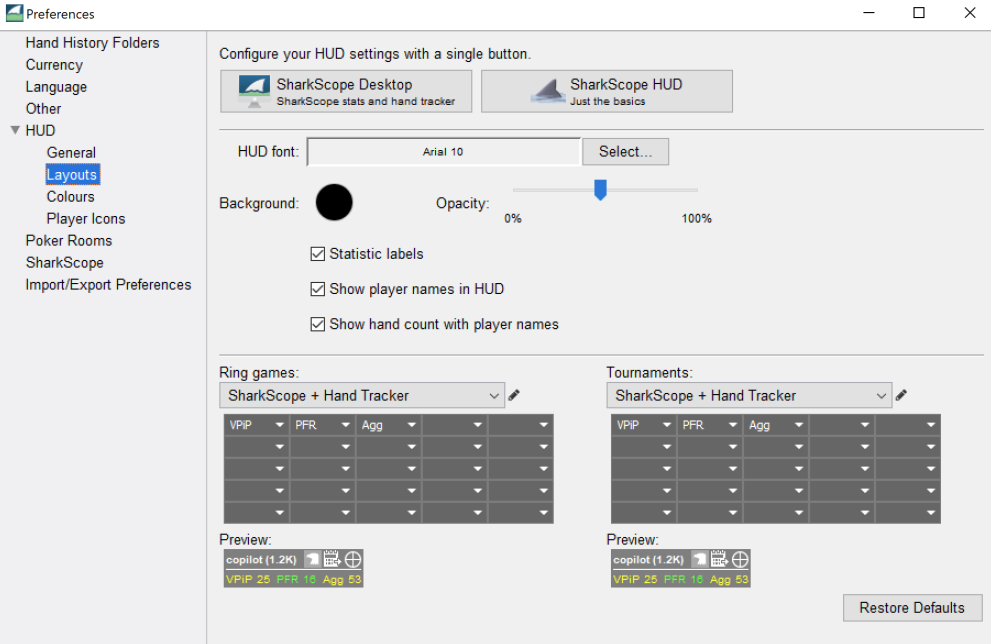
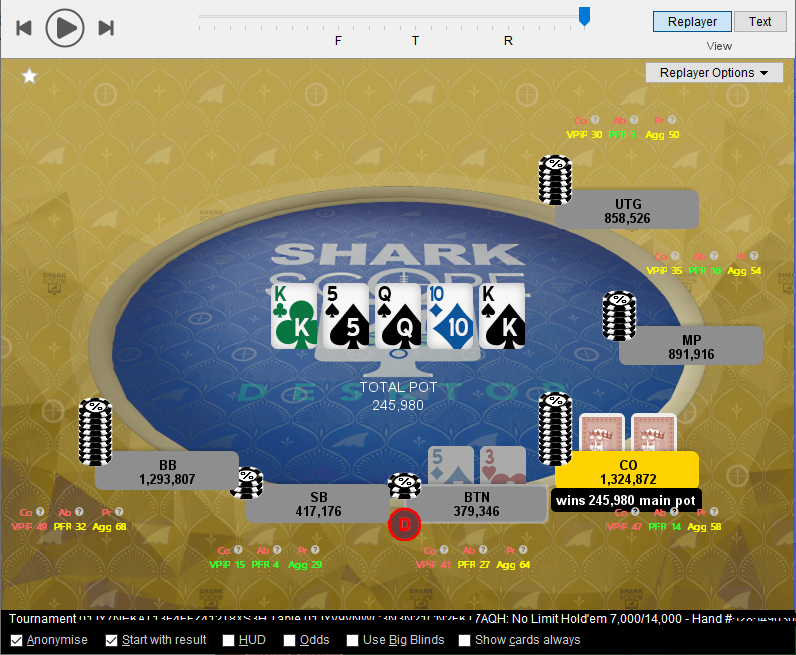
HUD is a statistics panel displayed directly on the poker table next to each player. You do not need to launch it separately: while the software is running, the panels automatically appear on tables in all supported poker rooms. The panel can display any metrics from the database, including ROI, ITM, tournament count, average buy-in, and Ability rating. Pressing and holding the panel opens a popup with the full set of available statistics for that player. You can customize the metrics, their positions, and highlighting rules, including while you are playing.
It is important to understand how the HUD uses your allowance: it consumes one search for each player at the table if their data is not already cached. The cache can be configured to retain statistics for one hour or one day, which can save a substantial number of searches when multitabling.
HandTracker is a module that reads hand history files from your computer and uses them to maintain your own hand database. Unlike the service’s main database, it provides familiar playing-style statistics such as VPIP, PFR, and aggression factor because its source is actual hand histories. It supports Hold’em and Omaha and, importantly, works fully with cash tables even though the main service does not track cash games. Statistics from the main database and your own hand histories are displayed in the same HUD panel.
The module also includes detectors for common mistakes. They analyze your play and identify recurring problems, such as insufficient or excessive preflop aggression, failing to account for position, attempting to steal the blinds too rarely or too often, and mishandling pocket pairs and suited connectors. For beginners, this provides a concise list of the areas that deserve attention first.
Other features include a hand replayer with street-by-street analysis, bankroll reports, an all-in equity graph, a 13×13 starting-hand matrix, and a tool for creating custom graphs using more than twenty metrics.
Sync automatically uploads results. The software checks whether every tournament you have played has been added to the service’s database and uploads any missing results, ensuring complete coverage of your own tournament history. For PokerStars, it can also submit rebuy and add-on data so that your costs are calculated accurately. Synchronization consumes one search for every one hundred tournaments.
AI-Powered Hand Analysis
Another feature available with every paid plan is AI-powered hand analysis. Paste a hand history into the text field, and the service returns a street-by-street review explaining which decisions appear reasonable, where the line deviates from what would be expected, and what could have been done differently. This analysis does not replace a solver or provide a mathematically precise answer, but it helps beginners develop the habit of questioning their own decisions. The same tool is built into the desktop application’s replayer.
Compatibility: Formats, Poker Rooms, and Operating Systems
Games and formats. The main database covers tournaments only: MTTs, sit-and-gos, spins, and other games with buy-ins. Cash games are not tracked in the service’s database. The HandTracker module does work with cash-game hands, but it uses your own hand history files rather than the service’s database.
Poker networks. The service covers most major platforms, including PokerStars and its regional versions, Winamax, 888poker, the iPoker network with several dozen rooms, regional versions of PartyPoker and BetMGM, Winning Poker Network rooms such as America’s Cardroom and PokerKing, Merge, and Revolution. For GGPoker and CoinPoker, the desktop application can track your own hands, but the database-powered HUD is unavailable.
Known poker room limitations. The international version of PartyPoker is not supported because the room restricts access to hand history files. WSOP NJ and 888 Poker NJ are not supported because all HUDs are prohibited there. PokerStars.NET and .BET are unsuitable because they do not save hand histories locally. The iPoker network is supported only on Windows. Tables with anonymous screen names cannot be searched in the database at all.
Operating systems. The desktop application runs on Windows and macOS. The minimum requirements are Windows 7, 8, or 10, or macOS 10.11 and later; 4 GB of RAM, with 8 GB recommended; a processor running at 2 GHz or faster; and at least 1 GB of free disk space after installation. The hand database takes up approximately 1 GB for every 200,000 hands. Compatibility should be checked before purchase for certain combinations of older Mac computers and newer macOS versions.
Browser and mobile. Search and all statistics are available in a browser on any operating system. Apps for iOS and Android provide access to search, filters, and tournament histories; an active subscription is required to use them. The HUD and hand tracking remain exclusive to the desktop application.
Simultaneous devices. An account can be used on no more than two devices at the same time.
Poker room rules. Use of the service is permitted on all supported platforms. The terms specifically state that using statistics to insult players in chat is prohibited and may result in account closure.
How to Get Started
Getting started takes only a few steps.
Step one: try it for free. You do not need to register on the website to perform your first searches: five searches per day are available immediately. It makes sense to use them on your own screen name and a few familiar opponents from your network to see how completely the relevant stakes and formats are covered. Free searches do not work through VPNs or proxies and are unavailable if someone else at the same address has already used them.
Step two: create an account. A free account saves your settings and linked screen names and reduces the amount of advertising, but it does not increase the daily search allowance.
Step three: choose a plan. If you only need statistics for post-session analysis, the entry-level paid plan with advanced filters should be sufficient. If you want data displayed directly at the table, you will need the Silver plan or higher, as this is the first tier that includes the HUD.
Step four: install the desktop application. Download it from the website and then specify the hand history folders in the settings and configure your poker room. In the poker client, you must enable the saving of hand histories and tournament summaries. The HUD will then appear automatically at the tables.
Step five: manage search usage. Before a long session, set the cache retention period and limit the number of metrics shown in the panel. Otherwise, multitabling may use up your daily allowance faster than expected.
Plans at a Glance
Free access is limited to five searches per day. Paid plans differ primarily in their daily search allowances, ranging from ten searches on the entry-level plan to several thousand on the higher tiers. The second difference is the set of available tools: the HUD and result synchronization become available on the mid-tier plan, while personal hand tracking, data exports, and time-of-play statistics are unlocked on the next tier. The hand-tracking module can also be purchased separately for a one-time fee, but database searches are not included. Quarterly and annual billing cost less than paying monthly.
A detailed description of the plans and prices is available on the product page.
Conclusion
For tournament poker beginners, SharkScope covers the part of preparation that is not directly related to studying strategy: it shows who is sitting at the table, which tournaments attract weaker fields, and how your own results look over a meaningful sample. The service will not tell you how to play a specific hand—for that, you need trackers and solvers—but it prevents you from playing blind against unfamiliar screen names.
It is best to learn the service gradually. Start with searches and the core metrics: tournament count, ROI, and average buy-in. Then move on to filters, which turn broad statistics into relevant information. Later, as your playing volume increases, explore tournament selection, the in-game HUD, and analysis of your own hands. This approach ensures that you do not pay for tools you are not yet ready to use or become overwhelmed by metrics whose meaning is still unclear.

Featured software

Latest posts
-
 Poker Academy Review: Ranges, Solver, and Trainer in One Browser Window Oct 11, 2026
 -
 SmartHand Review: Opponent Stats Before the First Hand Oct 10, 2026
 -
 888Caption Review: A Tool for Fast-Paced Multi-Tabling Oct 9, 2026
 -
 Preflop ICM Solving in GTO Wizard: ICM-Aware Preflop Solutions in Seconds Oct 8, 2026
 -
 Octopi Poker Review: Tournament GTO With Pro Hand Reviews Oct 7, 2026
All the poker software you need, gathered in one place. Exclusive discounts, bonuses, latest news and updates.
Join now