MDA Demon Review: Player Pool Statistics Compared to GTO Solutions
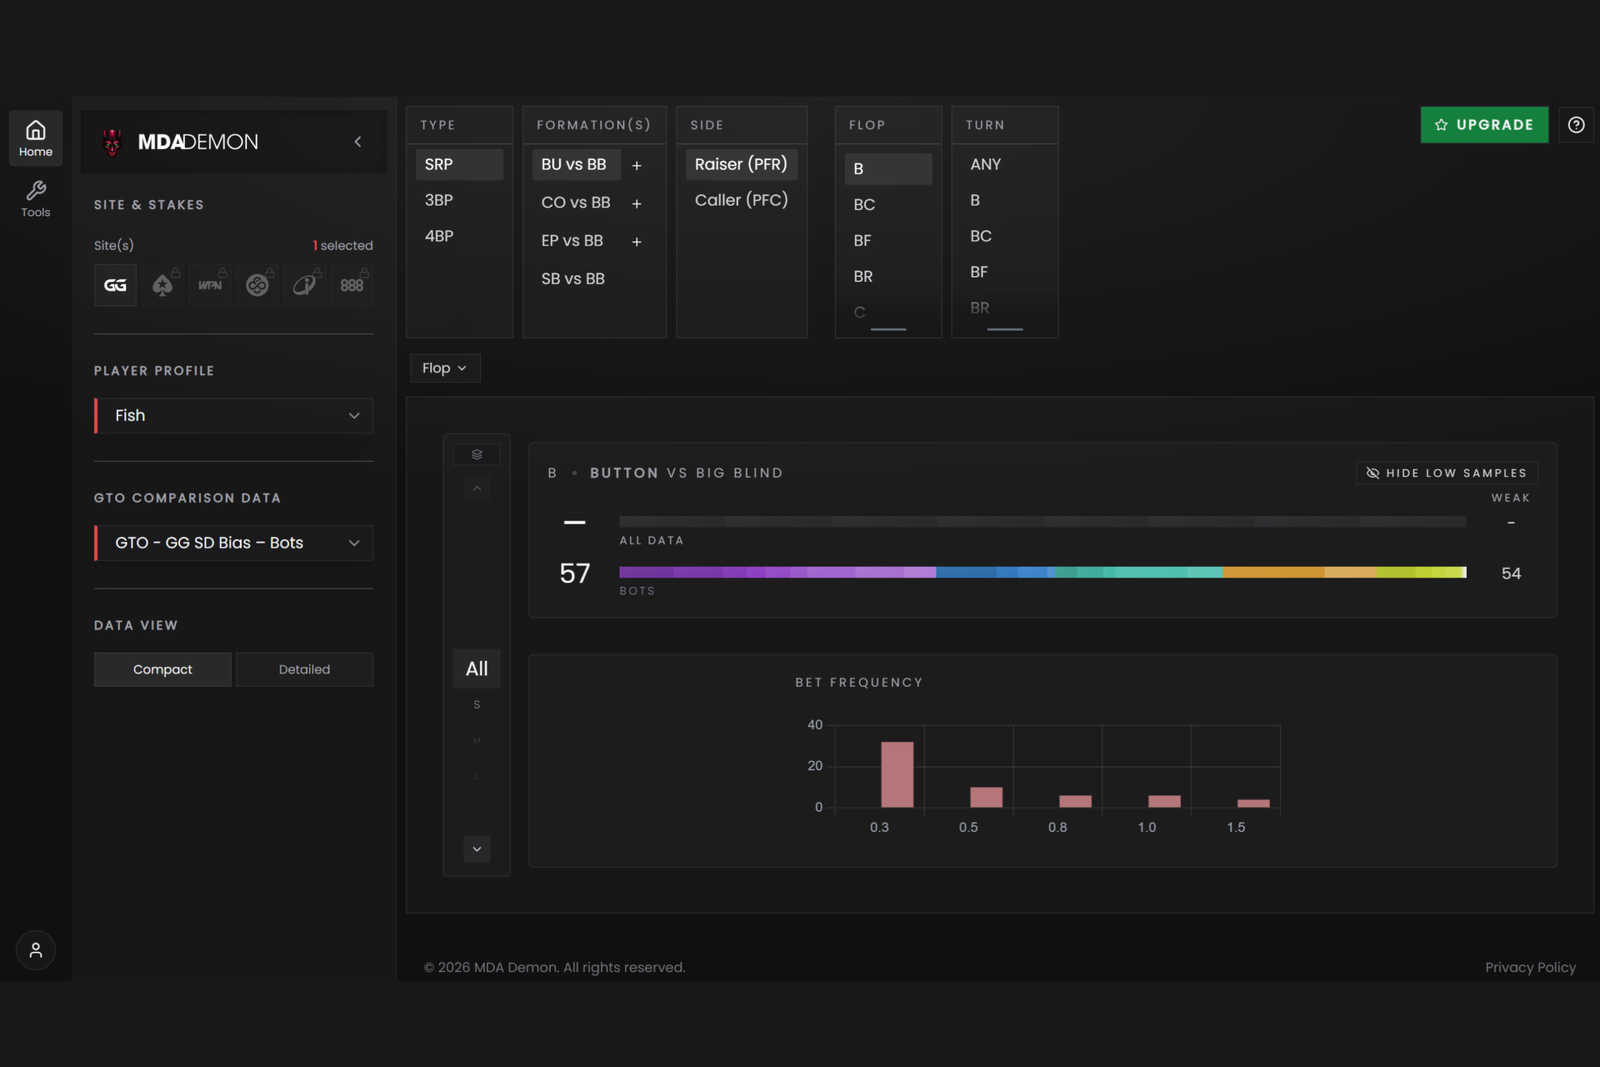
MDA Demon is a browser-based platform for mass data analysis of No-Limit Hold’em hands. It answers one practical question: how opponents at a specific stake play on average, and how much their play deviates from an optimal strategy.
Mass data analysis (MDA) is the study of poker using an enormous sample of played hands. Instead of examining a single questionable hand, it analyzes the behavior of the entire player pool: how often players bet the flop in 3-bet pots, which hands they use to call river bets, and which bet sizes they choose. A pool is the entire group of opponents playing in a particular poker room at a particular stake. Every pool has its own tendencies, and consistently exploiting its recurring mistakes is what generates long-term profit.
The traditional path to this kind of analysis is a long one: you need to build your own database containing millions of hands, import it into a tracker, configure filters, and wait for each query to run. The platform eliminates this process entirely—all calculations have already been completed, and users work with ready-made data.
How the Data Is Compiled and How to Read the Numbers
The platform is built around two different datasets that are displayed side by side.
The first consists of real hands played by human players. According to the developers, more than 172 million cash-game hands have been processed, with the data divided by stake and poker room. The second dataset consists of so-called GTO bots. These are not real opponents but hands generated by the developers themselves: they calculated strategies using a solver—a program that determines a mathematically optimal equilibrium strategy for a given situation—and then had those strategies “play” a large number of hands against each other. The result is a benchmark dataset in the same format as the human data: not a rough estimate, but a complete sample that can be properly compared with real-world statistics.
A key concept on the platform is the game-tree node. A game tree represents the complete structure of possible actions in a hand: who opened the action, who responded, and what happened on the flop, turn, and river. Each decision point is a node. The platform lets you navigate through the tree to a specific point and see what human players do there compared with the bots.
The difference between the two rows represents the pool’s deviation. If human players bet the river 54% of the time while the benchmark strategy calls for 58%, the pool is underbluffing, making it more profitable to fold more often against them. Conversely, if the pool is overbluffing, you should call wider. The platform calculates this difference automatically and converts it into winnings measured in big blinds, showing not only the direction of the mistake but also its cost.
Navigating the Game Tree: How to Find a Specific Situation
The path to any node is built using the filters at the top of the screen, moving step by step from left to right.
Pot type. There are three options: SRP (single-raised pot—a pot with one open-raise and a cold call), 3BP (a 3-bet pot), and 4BP (a 4-bet pot). This is the first and broadest distinction: play in a single-raised pot differs fundamentally from play in a 4-bet pot, with different ranges and different stack-to-pot ratios.
Formation. The pair of positions involved in the hand: SB, or small blind, versus BTN, or button; BB, or big blind, versus CO, or cutoff; BTN versus EP, or early position; BB versus SB; and so on. Position determines both range strength and the postflop order of action, so formations cannot be combined—statistics for “the button in general” would be meaningless.
Side. The preflop aggressor (PFR—the player who made the last raise before the flop) or the preflop caller (PFC—the player who called). These two roles have completely different postflop objectives, so their data is displayed separately.
Actions by street. Next, you select the sequence of actions on the flop, turn, and river: bet, check, call, fold, raise, or combinations of these actions. For example, the sequence “check-call, check, bet” means that the player checked and called a bet on the flop, both players checked the turn, and then the player bet the river. This notation lets you reach any specific line—for example, to see which hands the pool bets on the river after passive play on the first two streets.
Bet size. Bets are divided into small, medium, and large size groups, or you can view all sizes at once. This matters because different sizes represent different ranges: a large bet is usually polarized between very strong hands and bluffs, while a small bet is generally made with a much wider range.
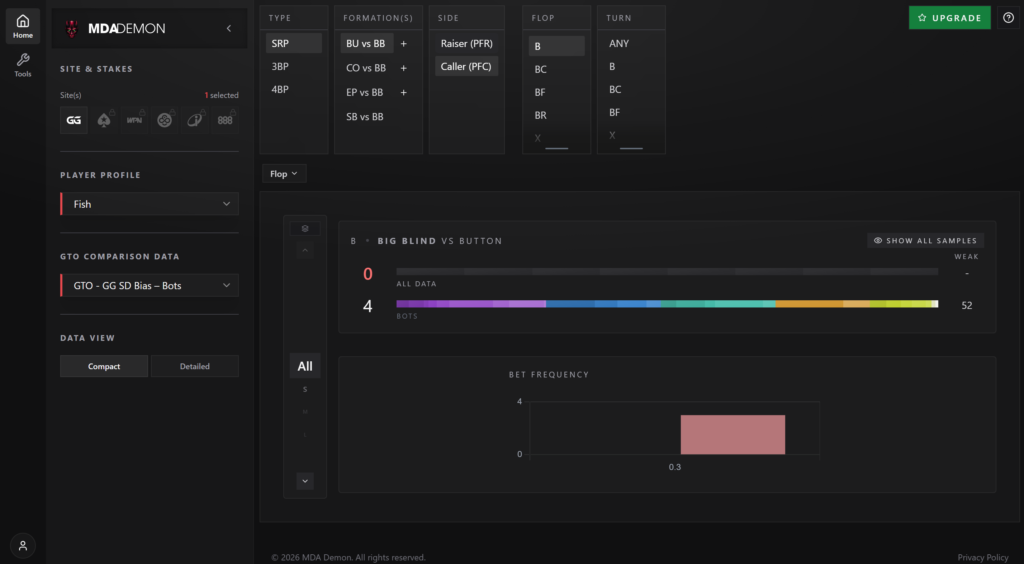
There is also a toggle that hides nodes with small sample sizes. It prevents random outliers in rare lines from being mistaken for meaningful patterns: you cannot draw a reliable conclusion from ten hands, but you can from several thousand.
Range Composition: Which Hands the Pool Plays at Each Decision Point
After selecting a node, the user sees the range broken down by hand category. The categories are sorted from weakest to strongest: air (a hand with no made value), king-high, ace-high with kickers of varying strength, pocket pairs of different ranks, bottom pair, middle pair, top pair with a weak or strong kicker, overpair, two pair, trips, set, straight, flush, and full house. Each category includes both a percentage and the exact number of hands used to calculate it.
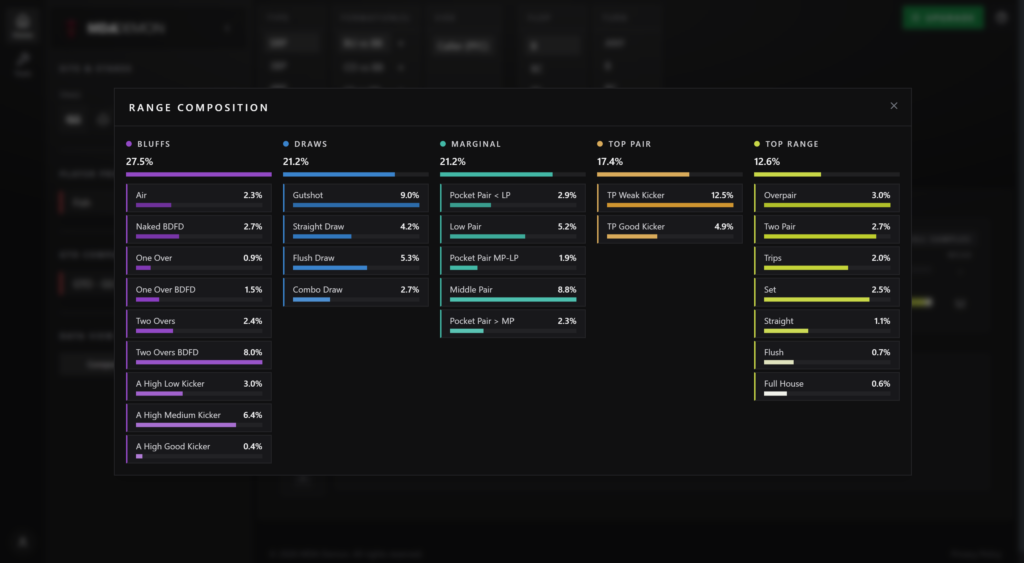
This answers the question, “Which hands are they doing this with?” For example, you might see that on a specific line, 11% of the pool’s river-betting range consists of air, while the benchmark bluffs noticeably wider. The practical conclusion is straightforward: against this pool, a river bet is more likely to represent a made hand, making weak bluff-catches unprofitable.
The sample counts shown next to the percentages are not merely decorative—they indicate which figures you can rely on. A percentage based on 2,700 hands is trustworthy; one based on twenty is not.
Pool Segmentation: Recreational Players and Regulars
Rather than showing a single abstract average opponent, the platform divides the pool into separate segments: recreational players and regulars. This distinction is essential in practice.
Recreational players generally play too many hands, rarely run large bluffs, and struggle to fold medium-strength hands. Regulars play closer to an optimal strategy, but they have their own systematic tendencies—for example, they may fold too often on certain board textures or avoid large river bets. Using the same game plan against both groups can produce opposite results: trying to bluff-catch against someone who does not bluff costs money every time.
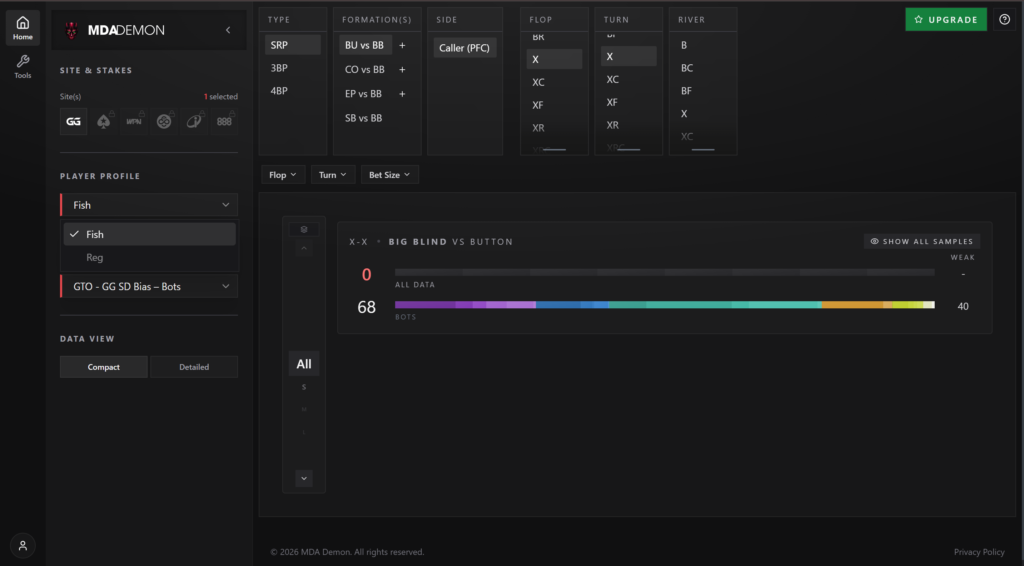
By selecting a segment, the user is effectively asking, “How does this specific type of opponent play against me?” All statistics—frequencies, range composition, and responses to bets—are then recalculated for the selected segment, with the benchmark row remaining alongside them for comparison.
Betting Frequencies and Responses: Where the Pool Loses Money
In addition to range composition, the platform displays two sections that often provide directly actionable answers.
The first shows betting frequencies by size. The chart shows how often the pool selects each bet size at a particular decision point and how often the benchmark strategy uses it. A systematic imbalance here makes the pool more readable: if the pool uses a large size much less often than the benchmark, the appearance of a large bet becomes a strong signal of hand strength.
The second section shows responses. It displays what happens after a bet: how often the opponent folds, calls, or raises. Each figure is shown alongside its benchmark value, with the direction of the deviation highlighted. This section answers two of the most profitable questions in poker: should you bluff here, and should you bluff-catch here?
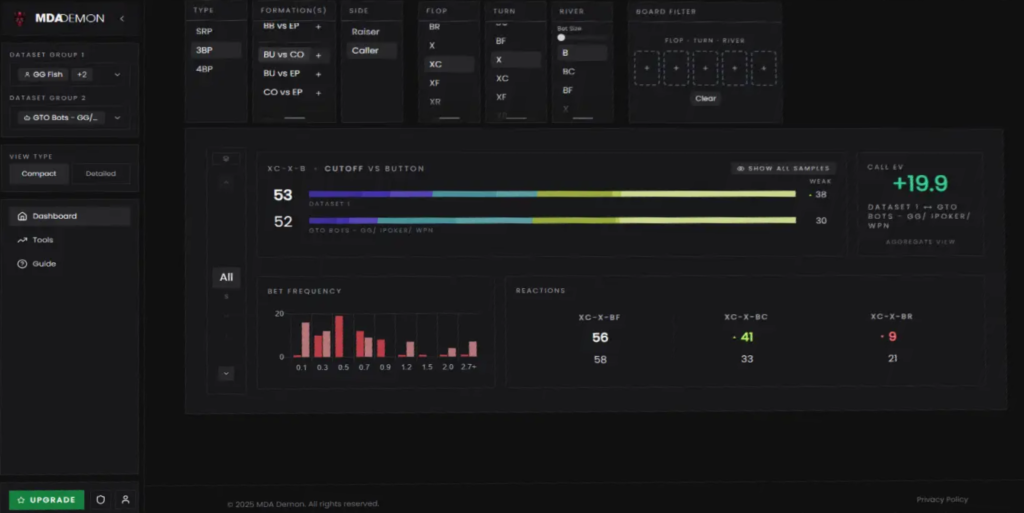
Deviations are converted into monetary value—the platform calculates the profit in big blinds generated by exploiting a specific pool mistake. This turns an abstract percentage difference into a practical benchmark, making it clear which lines deserve to be studied first and which deviations are too small to warrant attention.
Precomputed Results Instead of Your Own Database
It is worth taking a closer look at the principle that distinguishes the platform from conventional mass data analysis performed in a tracker.
To obtain comparable figures yourself, you would need a database containing tens of millions of hands from the relevant stake and poker room. Building one from your own play within a reasonable timeframe is impossible—even at commonly played stakes, it would take years. You would then need to process the database: create filters for every node in the game tree, wait for each query to run, and repeat the process for every adjacent situation. In practice, this is a separate job that requires both time and a solid understanding of how the tracker works.
Here, all calculations have already been completed and stored in a ready-to-use format. Moving from one node to another means changing a filter rather than running a new database query. This changes the nature of studying itself: instead of conducting one deep analysis per week, you can quickly review dozens of related situations in a single study session.
The trade-off is that the platform works only with aggregate pool data. It does not replace a tracker: it knows nothing about the user’s own play, does not provide an in-game HUD, and does not analyze personal hand histories. It is a study tool, not a tool for use during play.
Compatibility: Formats and Poker Rooms
Game and format. No-Limit Hold’em cash games only. The data does not include tournaments, Spin&Go games, other poker variants, or Omaha.
Poker rooms. The official website lists GGPoker, PokerStars, ACR, CoinPoker, iPoker, and 888poker. However, the subscription plans list datasets by stake rather than by poker room, so it is worth confirming which data is available for each specific platform before subscribing.
Stakes. The datasets cover NL50, NL100, the NL200–NL500 range, and the NL1000–NL10000 range. Micro stakes below NL50 are not included in the library.
Platform. MDA Demon is entirely browser-based: it works on Windows, macOS, and Linux, requires no installation, and performs all calculations on the service’s servers. There is no dedicated mobile app, and the interface—with its data-heavy tables and charts—is designed for a computer screen.
Limitations. The data shows the behavior of the pool as a whole rather than individual players: there is no nickname search or opponent-specific data. Users cannot upload or analyze their own hand-history databases. An account is required to access the platform; it cannot be used anonymously.
How to Get Started
Getting started takes only a few steps.
- Register on the website using your email address. No bank card is required at this stage.
- Activate free access. This includes the full interface and one dataset covering recreational players at NL50 on GGPoker. That is enough to learn how to navigate the game tree.
- Start with a simple situation. A sensible place to begin is a BTN-versus-BB single-raised pot: this is the most common situation in cash games and has the largest sample of hands.
- Move on to specific lines. After selecting a side and a sequence of actions by street, compare the pool’s frequencies with the benchmark and pay particular attention to the response section—this is where deviations become actionable decisions.
- Upgrade your access if necessary. If you need data for other stakes or access to the full set of nodes and formations, you can subscribe to a paid plan.
It is best to learn the platform by moving from broad patterns to specific details: first identify the pool’s major imbalances in common lines, then move down to rare nodes with smaller sample sizes.
Pricing Plans
Access is subscription-based, with three available tiers. The free tier provides access to the interface and one NL50 dataset for recreational players. The middle tier removes restrictions on game-tree nodes and formations and adds NL50 and NL100 data together with benchmark GTO-bot datasets. The highest tier unlocks the entire library, including mid- and high-stakes data. Payments are charged on a recurring basis, subscriptions can be canceled at any time through the user account, and access remains active until the end of the paid period.
A detailed description of the plans and prices is available on the product page.
Conclusion
MDA Demon covers an area of poker study that is usually inaccessible to beginners. A new player does not—and realistically cannot—have a personal database containing millions of hands. Without one, discussions about pool tendencies are reduced to guesswork and secondhand advice. The platform provides this data in a ready-to-use format and displays it directly alongside the benchmark, so conclusions are based on specific figures rather than general observations: where the pool underbluffs, where it folds too often, and how much those mistakes are worth in big blinds.
It makes sense to learn the tool gradually. Start with a few common situations, analyze them thoroughly, and apply the findings to your own game. Then move on to more nuanced lines and other pool segments. Trying to cover the entire game tree at once leads to information overload without practical results, while two or three well-understood adjustments in common situations can make a noticeable difference at the tables almost immediately.

Featured software

Latest posts
-
 Poker Academy Review: Ranges, Solver, and Trainer in One Browser Window Oct 11, 2026
 -
 SmartHand Review: Opponent Stats Before the First Hand Oct 10, 2026
 -
 888Caption Review: A Tool for Fast-Paced Multi-Tabling Oct 9, 2026
 -
 Preflop ICM Solving in GTO Wizard: ICM-Aware Preflop Solutions in Seconds Oct 8, 2026
 -
 Octopi Poker Review: Tournament GTO With Pro Hand Reviews Oct 7, 2026
All the poker software you need, gathered in one place. Exclusive discounts, bonuses, latest news and updates.
Join now