Flopzilla Pro Review: The Calculator That Instantly Shows Range Strength on Any Board
Flopzilla Pro is a tool for reviewing poker hands away from the table. Its job sounds simple: show how a given set of hands connects with a particular board. In practice, that’s exactly the question you have to answer at the table every time an opponent bets the flop — what can they actually have here, and how often is it something real?
People are bad at working this out in their heads. It feels like a player who opened from the CO almost always connects with an ace-high board, and then the software shows that they make top pair or better less than a third of the time, while they miss completely in roughly half of all hands. Numbers like these are what tell you when a c-bet works and when it just burns money.
Flopzilla Pro doesn’t connect to a poker client and doesn’t collect stats on opponents — it’s neither a tracker nor a solver. Cards and ranges are entered by hand, which makes it equally suited to reviewing online hands and live play. You don’t need it at the table; it’s a tool for homework between sessions.
How It Works in a Nutshell
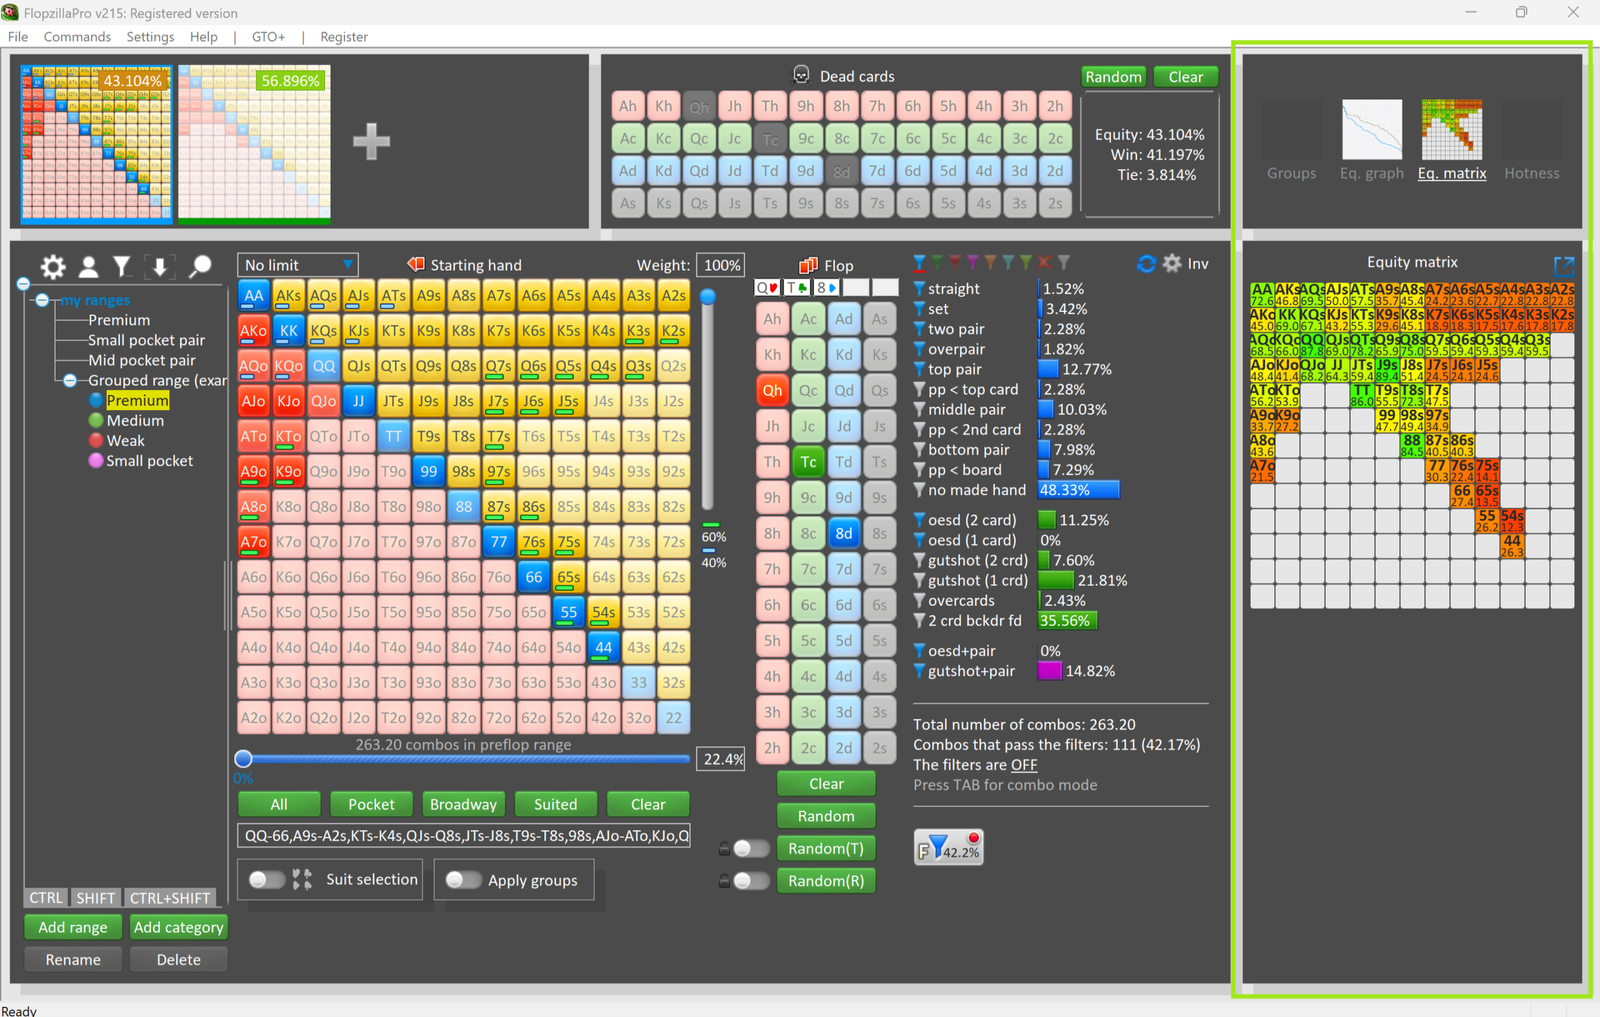
The software has three connected parts, and all three are visible on one screen.
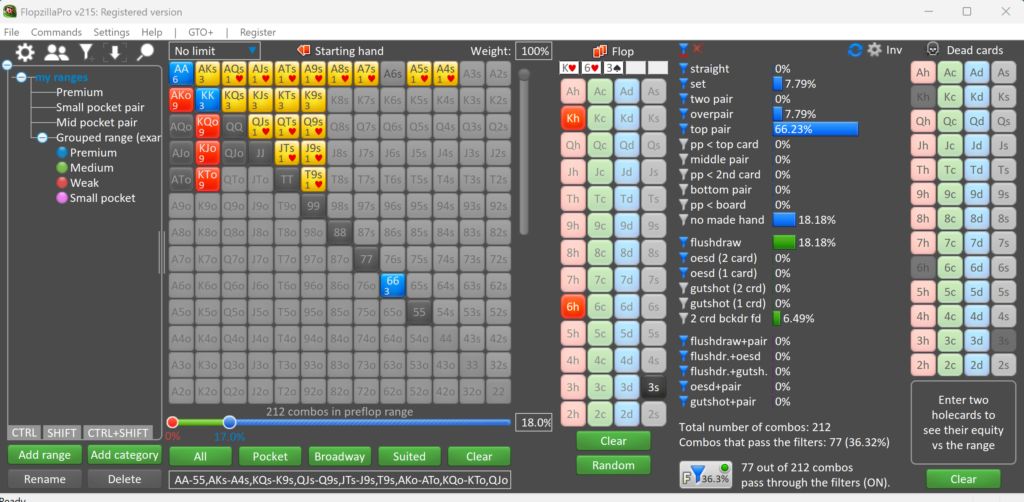
On the left is the range matrix. This is the familiar 13×13 grid where starting hands are checked off: AA, AKs, 76s, and so on. A range isn’t a single hand but the whole set of hands a player could be playing the spot this way with. A button open, for example, is roughly 40–45% of all starting hands.
In the center is the board. Flop, turn, and river are entered by clicking cards, and there’s a random-board button plus a dead-card field (cards that definitely won’t show up in the hand — your own cards, say, or cards an opponent has already shown).
On the right is the breakdown of made hands. The software takes every combination in the range, runs it against the board, and sorts the result into categories: quads or better, full house, flush, straight, set, two pair, overpair, top pair, middle pair, bottom pair, pocket pair, ace high, nothing, flush draw, open-ended straight draw, gutshot, overcards.
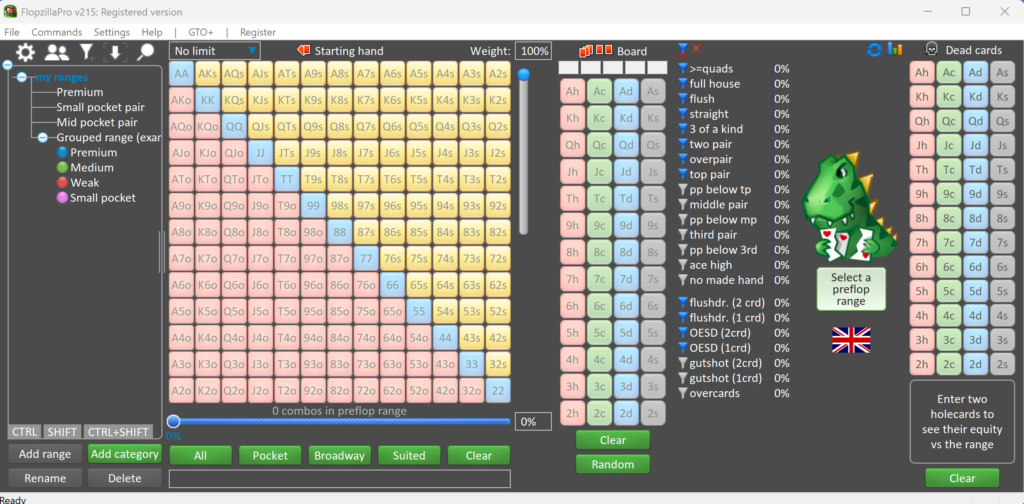
Everything else rests on a single principle: any change instantly recalculates everything else. There’s no “calculate” button — the numbers move the moment a card is added or a box is unchecked. That matters more than it might sound. A review stops being a series of calculations and turns into a run through the options, where you can see right away what depends on what.
The TAB key switches the display between percentages and combos. A percentage answers “how often,” a combo count answers “how many hands exactly,” and the second is easier to work with when you’re figuring out the ratio of value hands to bluffs.
Entering a Range: Matrix, Slider, and Saved Sets
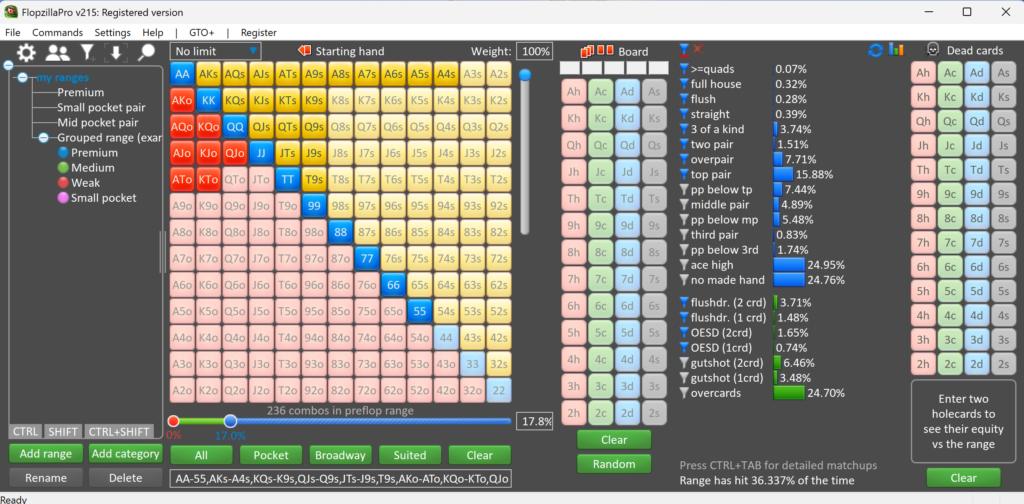
A range can be clicked in directly on the matrix, but there are faster ways too. Below the matrix sits a slider that adds hands by strength — the top 5%, 10%, 20%, and so on. For a quick estimate (“this opponent plays about 15% of hands”), that’s enough.
Fine-tuning happens by suit. A single cell in the matrix doesn’t have to be filled completely: you can leave only the suited combinations, for instance, or only specific suit pairings. For working through flush draws and blockers, this is essential.
Finished ranges are stored in a separate menu as presets. They can be sorted into categories and subcategories (“6-max cash,” “tournaments,” “vs regs”), renamed, deleted, and also added to and subtracted from one another: a BB cold-calling range plus a 3-betting range gives you the overall continuing range. Grouped ranges are supported separately — a single saved set made up of several color-coded parts, such as “raise,” “call,” and “fold.”
Ranges can also be imported: the software reads the formats used by other poker tools, so a set of charts exported from a trainer or a solver doesn’t have to be retyped by hand. The range file is stored locally and backed up automatically, so a library built up over months doesn’t disappear during a reinstall.
Made-Hand Breakdown: The Main Screen
The statistics column is what most people open the software for in the first place. It answers the question “what did this range turn into on this board,” and it does so in more detail than most calculators.
Each row is a separate hand category with a percentage and a combo count. Hovering over a row shows a detailed breakdown: what exactly makes up that number and which hands landed in it. At the same time those hands are highlighted in the range matrix, so you’re not looking at an abstract 12% but at specific cells.
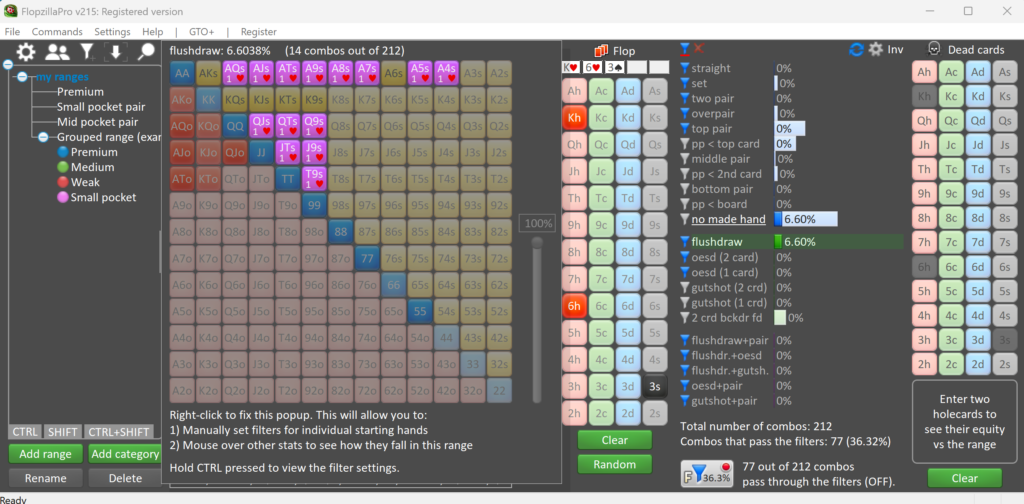
The software also shows overlaps between categories. A hand can be a middle pair and a gutshot at the same time, and if you simply add the percentages up, it’s easy to end up with more than a hundred. The overlap mode shows how many hands fall into several selected categories at once, which protects you from a very common counting mistake.
One useful detail for a beginner: the list of categories isn’t fixed. Right-clicking a row opens its settings — you can specify, for example, what counts as a “middle pair” on a particular board.
Filters: Turning a Range Into a Continuing Range
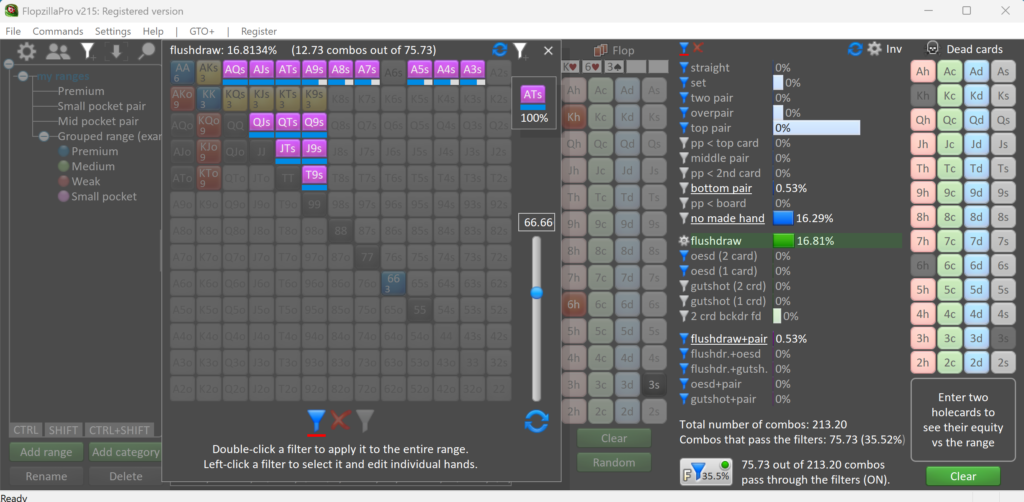
This is where Flopzilla Pro starts to differ from a plain odds calculator. Every row in the statistics column works not only as a readout but also as a filter.
The logic goes like this. You have an opponent’s opening range. On the flop they bet. That means part of their range would already have been folded and part continued. All you have to do is use the filters to check the categories you think they bet with, and the matrix will show only their betting range. From there you can enter a turn card and see how that narrowed range connects with it.
Filters are more flexible than a simple on/off switch:
- Weight. Hardly anyone bets a flush 100% of the time. A filter can be given a frequency: with a made flush the opponent continues 70% of the time, with a gutshot 30%. The software factors those shares into the count.
- Color groups. Filters of different colors work independently, so the result can be broken out into “betting for value,” “betting as a bluff,” and “checking,” with a clear split by color.
- Removal and inversion. A separate filter takes hands out of the range entirely, and an invert button flips the selection, leaving exactly what the filter didn’t catch. The second one is handy when it’s easier to describe what an opponent definitely doesn’t continue with.
- Priority. If a hand fits two conflicting filters at once, a priority rule applies and the software shows which one wins.
- Text output. The resulting range can be exported as a text string to save in your notes or move into another tool.
There’s one practical takeaway here for a beginner. Reviewing a hand almost never comes down to the math — it comes down to the assumptions: what does the opponent bet with, and what do they give up with? Filters don’t answer that question for you, but they force you to state the assumption explicitly and then immediately show you where it leads. Very often it turns out that a carefully described continuing range is half as wide as it seemed.
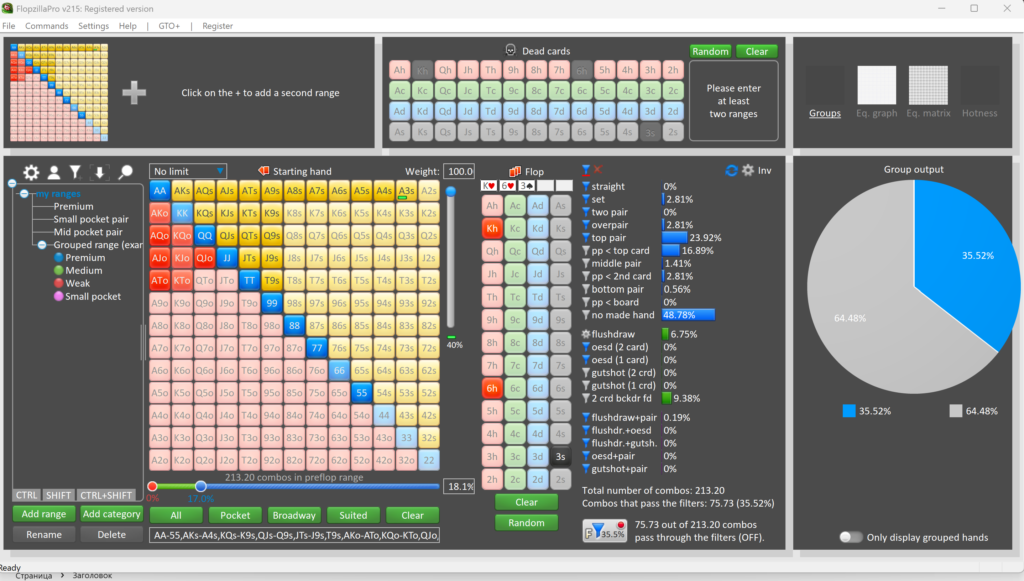
Color Groups and the Pie Chart
Group mode turns a column of numbers into a picture. Categories are shaded in several colors — “strong hands,” “medium,” “draws,” “trash,” for instance — and the range distribution is shown as a pie chart.
The point isn’t decoration. The structure of a range — what’s in it and how much of each — matters more than overall equity. The chart shows that at a glance, and it sticks: after a dozen boards, what stays in your head isn’t a table but a visual impression that “on a board like this they mostly have air.”
Equity Calculation
Equity is the share of the pot that a hand or a range wins on average if the hand is played to showdown with no further betting. Flopzilla Pro calculates equity in several modes:
- Hand vs. range. The classic problem: how a specific hand does against an opponent’s assumed set of hands.
- Range vs. range. A more honest way to frame the question postflop, where your own hand is part of a range too.
- Multiway calculation. The software handles up to twelve players at once. Exact postflop equity for three players is calculated in under a second, which is a rare capability for multiway pots.
- Monte Carlo mode. For the heaviest calculations it uses an approximate method: the result appears almost instantly, with a margin of error that doesn’t change any conclusions.
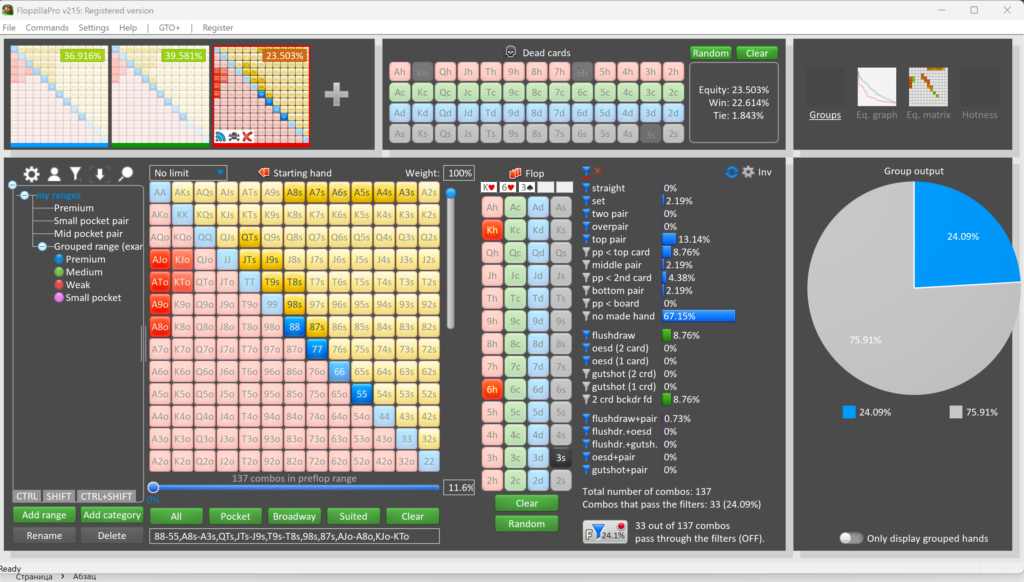
It also accounts for details that ordinary calculators ignore. Dead cards — cards that definitely won’t appear on the board. Card removal from folded players (bunching): if several players folded, the cards that left the deck weren’t random but mostly weak, so the remaining deck is slightly stronger. The effect is small, but in multiway pots and tournament spots it’s noticeable.
Display Modes: Graph, Matrix, and Hotness
A single number like “54% equity” hides too much: that 54% could be a flat 54% for every hand, or it could be half monsters and half garbage. Those two ranges play completely differently, so the software gives you three ways to look at the distribution.
The equity graph lines up every hand in the range by strength, best to worst. A steep drop at the start means a polarized range; a gentle line means a linear one. The line color matches the frame color of the corresponding range, so two or three ranges can be compared on one graph.
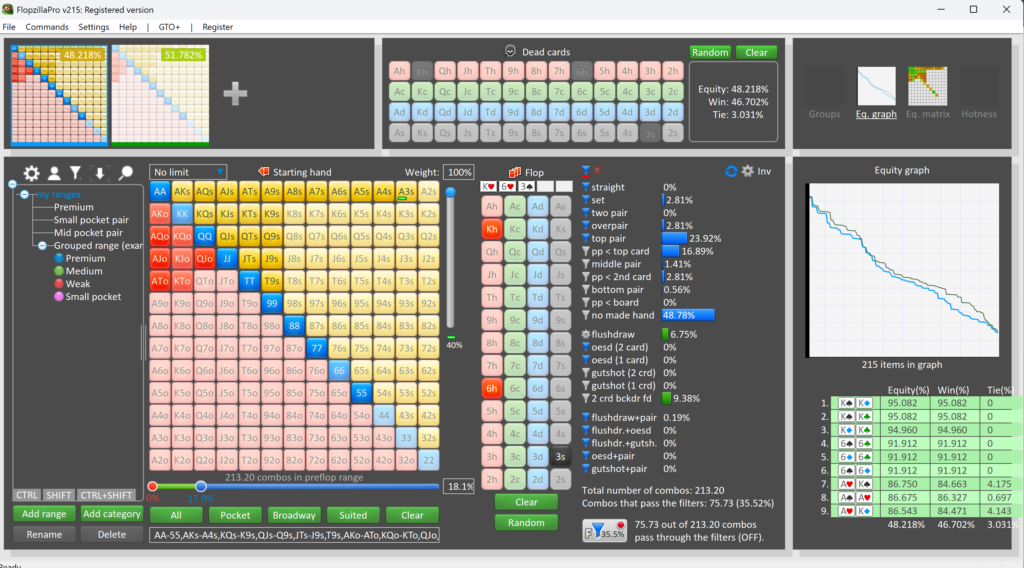
The equity matrix shades that same 13×13 grid by hand strength on the current board. You can see immediately which hands continue and which are easy to fold without regret. For practicing hand reading, this is probably the most intuitive mode.
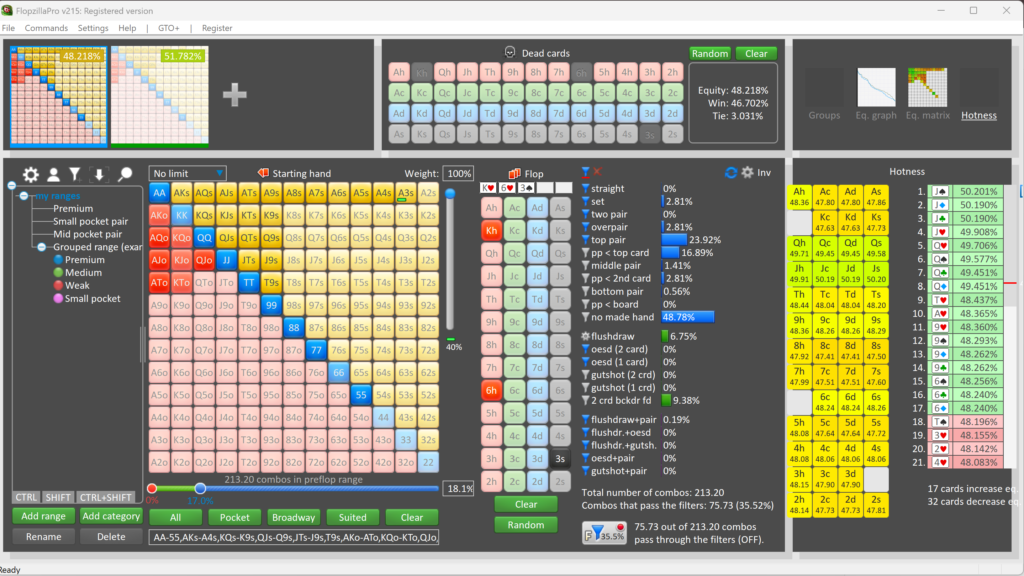
Hotness shows which next-street cards help the range and which ones hurt it. The scale colors ranks and suits: some turn cards strengthen the range, others flip the spot in the opponent’s favor. That leads directly to a decision about whether to build the pot now or wait for the next street more cheaply.
Preflop Statistics: A Range Against Every Flop at Once
Everything above applies to one specific board. But there’s a second way to work: remove the board entirely and look at how a range behaves on average — across all 22,100 possible flops at once.
The numbers here are very precise. Pocket eights, for example, are an overpair on a rainbow flop about 4.29% of the time. Each category opens into a tooltip with the details.
The practical value for a beginner is obvious: half an hour spent plugging in standard ranges (a UTG open, an MP open, a big blind defense against an open-raise) gives you reference points that later surface at the table on their own — how often a range connects with anything at all, and what share of those hits are weak pairs.
Flop Type Analysis
A separate tool answers the neighboring question: how often does a given type of board come up at all? Again down to fractions of a percent — an unpaired flop appears 82.82% of the time, a monotone flop (three cards of one suit) 5.18%, a king-high flop with two cards of one suit 8.96%.
Flops are sorted by type: trips, paired, unpaired, by top card, and by straight structure (how connected the board is). You can set conditions and get the subset of flops matching that description, along with examples of specific boards.
Why this matters. Strategy isn’t built for a single board but for groups of boards: “on dry ace-high boards you bet almost your whole range,” “on connected low boards betting becomes selective.” For rules like these to mean anything, you need to know what share of all hands each group accounts for. This tool hands you those shares ready-made.
Custom Stats
Sooner or later the standard set of categories stops being enough. The software lets you build your own stat out of conditions — “top pair plus a flush draw,” say, or “any draw with two overcards.” There’s a dedicated operator for suits, so suit combinations are covered as well.
Custom stats join the main column, can be used in filters, and are saved as a default setting. Row order is changed by dragging, unwanted rows are deleted, and a reset restores the original set.
A beginner won’t need this right away, but this is the point where the software stops being a reference book and becomes a working tool: the categories get shaped around the strategy you’re actually studying.
Integration With the GTO+ Solver
GTO+ is a solver from the same developers. A solver is software that calculates the equilibrium strategy for a given bet tree: how often and with which hands to bet, call, and fold. Flopzilla Pro can exchange data with it in both directions.
Here’s how it works. A spot solved in the solver is exported to Flopzilla Pro along with the active ranges and the board, where it’s convenient to examine with the familiar tools — the made-hand breakdown, the pie chart, hotness. In the other direction, a range tuned by hand for a specific opponent (people don’t play equilibrium, and that’s normal) is passed to GTO+ so the spot can be calculated with that opponent’s real tendencies built in.
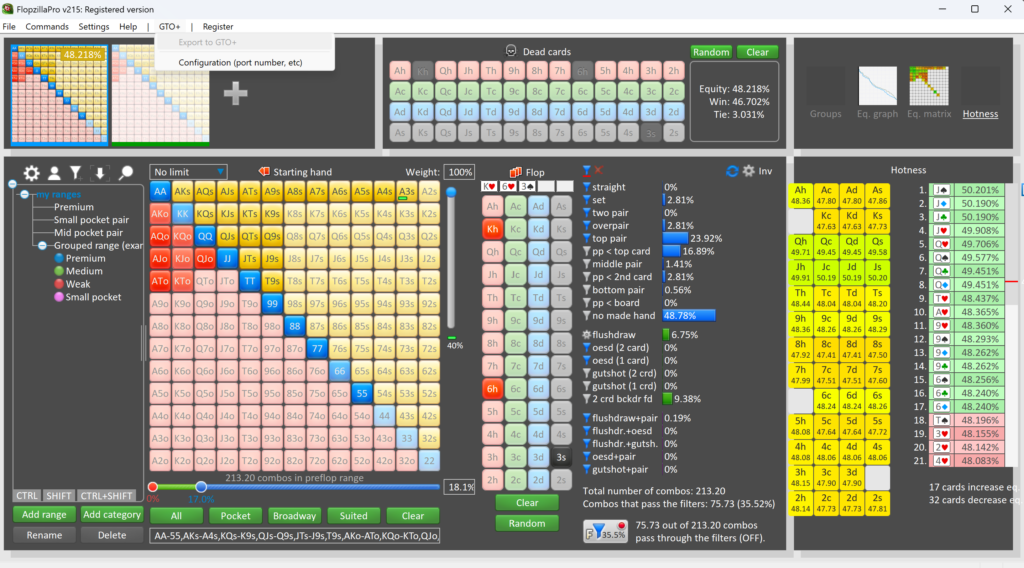
This is the most direct way to connect theory and practice: the equilibrium strategy sets the reference point, and editing the range by hand shows what changes when an opponent deviates from it. GTO+ is purchased separately and isn’t required for Flopzilla Pro itself to work.
Small Things That Make a Noticeable Difference
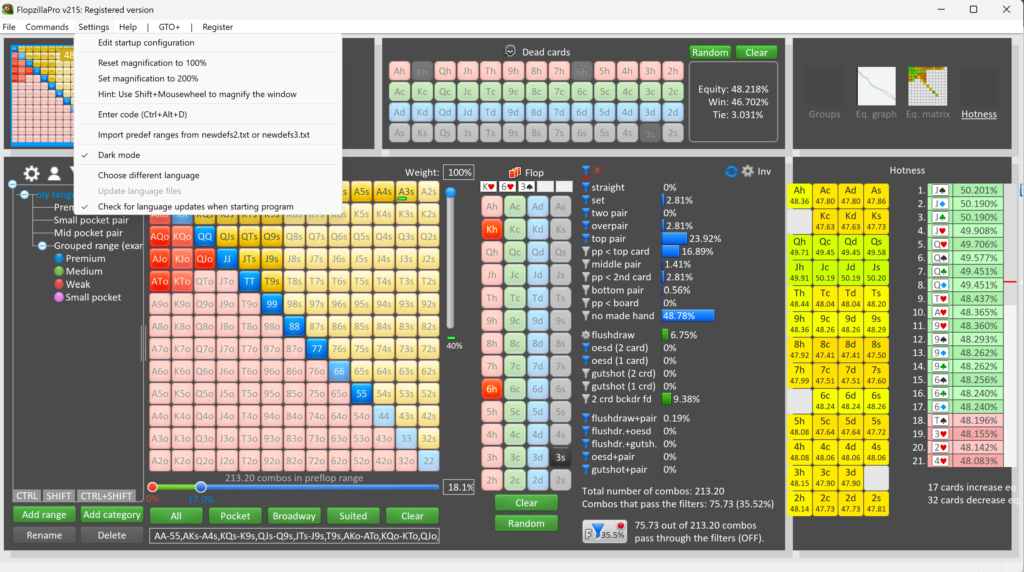
- Scaling. The window zooms with Shift plus the mouse wheel, and there’s a ready-made 2x mode. On large high-resolution monitors this is a lifesaver.
- Dark theme. A dedicated night mode for long evening review sessions.
- Interface language. Besides English, there’s Russian, Spanish, Chinese, Japanese, and Korean. The language is switched in the settings, and translation files are updated separately.
- Notes. A text note can be attached to the current spot — handy when you come back to the same hand a week later.
- Text output. Both the range and the statistics table can be exported as text to drop into your notes or a forum post.
Compatibility: Formats and Sites
Game. Texas hold’em only, both no-limit and limit. Omaha, short deck, and other poker variants aren’t supported.
Formats. No restrictions: cash games, tournaments, sit-and-gos, spins. The software works with cards and ranges, not with a table type.
Poker sites. There’s no tie to any room at all. Cards are entered manually, hand history files aren’t read, and no connection to a poker client is needed. That has a pleasant side effect: the software works just as well for live play.
Operating systems. Windows only, version 7 and newer. There are no official builds for macOS, Android, or iOS. On a Mac it runs only through Windows in a virtual machine or Boot Camp, and that solution comes with caveats. Hardware requirements are minimal: a dual-core 2 GHz processor, 1 GB of RAM, and 1 GB of free disk space.
Limitations worth knowing about up front. This isn’t a tracker: it doesn’t collect opponent stats and doesn’t display a HUD. It isn’t a solver either: it doesn’t calculate the optimal strategy but shows the structure of ranges and equity — for equilibrium solutions you need GTO+ or another solver. And it isn’t meant to be used while you’re playing at the table.
Getting Started
- Download and install. The installer comes from the official site; installation is standard and takes a couple of minutes.
- Start the trial. Seven days are counted from the first launch. The trial covers the flop only — turn and river cards can’t be entered — but that’s enough to get a feel for how the software thinks.
- Review one hand you already know. Don’t start by learning every button. Take a hand that recently left you unsure, enter your assumed range for the opponent plus the flop, and look at the statistics column.
- Add a filter. The next step is to check off what the opponent continues with and watch how the range narrows going into the turn.
- Save your own ranges. Enter your standard opening ranges by position into presets once, and after that a review takes seconds instead of minutes.
- Buy a license. After payment, the Hardware ID is taken from the “Register” menu and sent along with an email address through the form on the site; the key arrives by email within a few minutes.
The software has a predecessor — the original Flopzilla, released in 2010. Flopzilla Pro carries it forward and fully replaces it for everyday work, so Pro is the one to pick on the download page. The differences come down to what Pro added: a scalable interface, a dark theme, extra languages, pie charts with color groups, multiway equity calculation, the equity graph and equity matrix, the hotness scale, custom stats, and the GTO+ link. The license is shared and covers both versions.
Pricing
There’s no subscription — the software is bought once. The trial runs for seven days and is limited in features: flop only. A full license costs $25, never expires, covers two computers belonging to one owner, and includes all future updates. There’s no separate charge for Pro: one purchase covers both versions.
A detailed breakdown of plans and prices is on the product description page.
The Bottom Line
Flopzilla Pro solves one problem, but it solves it better than almost any alternative: it shows how a range of hands interacts with a board. For a beginner it’s the fastest way to stop thinking in terms of “what do I have” and start thinking in terms of “which hands are possible here and in what proportion” — and that shift is usually where losing poker ends.
It’s best learned gradually. For the first week it’s enough to enter a range and a flop and look at the statistics column. Then come filters and turn analysis, then equity calculation and the display modes, and only after that does it make sense to look into custom stats and the solver integration. The one-time $25 price with no subscription makes that unhurried pace completely painless.

Featured software

Latest posts
-
 OmahaPro Review: GTO Preflop Trainer for PLO4 & PLO5 Oct 12, 2026
 -
 Poker Academy Review: Ranges, Solver, and Trainer in One Browser Window Oct 11, 2026
 -
 SmartHand Review: Opponent Stats Before the First Hand Oct 10, 2026
 -
 888Caption Review: A Tool for Fast-Paced Multi-Tabling Oct 9, 2026
 -
 Preflop ICM Solving in GTO Wizard: ICM-Aware Preflop Solutions in Seconds Oct 8, 2026
All the poker software you need, gathered in one place. Exclusive discounts, bonuses, latest news and updates.
Join now